The air transport industry is not only a vital engine of global socio-economic growth, but it is also of vital importance as a catalyst for economic development. Not only does the industry create direct and indirect employment and support tourism and local businesses, but it also stimulates foreign investment and international trade.
Informed decision-making is the foundation upon which successful businesses are built. In a fast-growing industry like aviation, planners and investors require the most comprehensive, up-to-date, and reliable data. ICAO’s aviation data/statistics programme provides accurate, reliable and consistent aviation data so that States, international organizations, the aviation industry, tourism and other stakeholders can:
- make better projections;
- control costs and risks;
- improve business valuations; and
- benchmark performance.
The UN recognized ICAO as the central agency responsible for the collection, analysis, publication, standardization, improvement and dissemination of statistics pertaining to civil aviation. Because of its status as a UN specialized agency, ICAO remains independent from outside influences and is committed to consistently offering comprehensive and objective data. Every month ICAO produces this Air Transport Monitor, a monthly snapshot and analysis of the economic and aviation indicators.
ECONOMIC DEVELOPMENT – September 2021
World Results and Analyses for July 2021
Total Scheduled Services (Domestic and International)
Passenger traffic
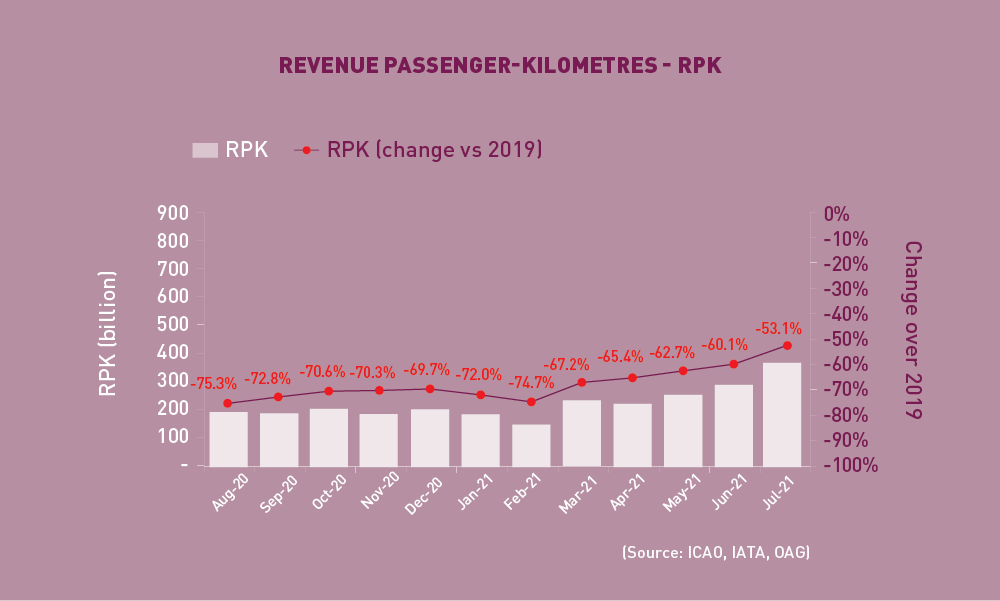
World passenger traffic fell by -53.1% in July 2021 (compared to 2019), +7.0 percentage points up from the decline in the previous month. The rebound of air travel was attributed to a combination of factors such as the traditional peak northern hemisphere summer travel, pent-up holiday travel demand, and progress in vaccine rollout globally. Nevertheless, the rapid spread of new variants poses risks to reversing the recovery trend. Domestic traffic continued to lead the recovery chart, with key domestic markets returning to above or close to pre-pandemic.
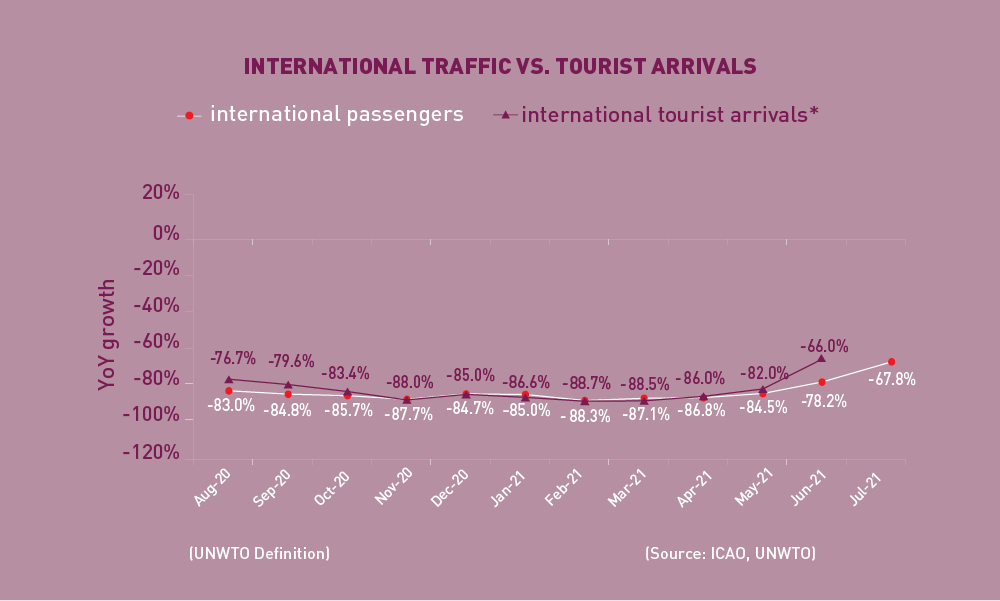
International passenger numbers fell by -67.8% in July 2021 (compared to 2019), +10.4 percentage points up from the decline in the previous month. International traffic rebounded across almost all key regions, particularly in Europe owing to the reopening of intra Europe travel. The international tourist arrivals also rebounded and followed a similar trend as international passenger traffic.
Capacity
Capacity worldwide fell by -45.2% in July 2021 (compared to 2019), +6.4 percentage points up from the decline in the previous month (-51.6%). Amidst the growing spread of the new virus variant, capacity is expected to maintain a similar level in August 2021 at -45.3% down from the 2019 levels.
Load Factor
The passenger Load Factor reached 73.1% in July 2021, +3.5 percentage points higher than the previous month. The domestic load factor returned to the level of over 80%, outperforming the international load factor. As the recovery of capacity was faster than travel demand recovery, the July LF remained significantly below 2019 levels at -12.6 percentage points lower.
Freight Traffic
Freight Tonne-Kilometres – FTK
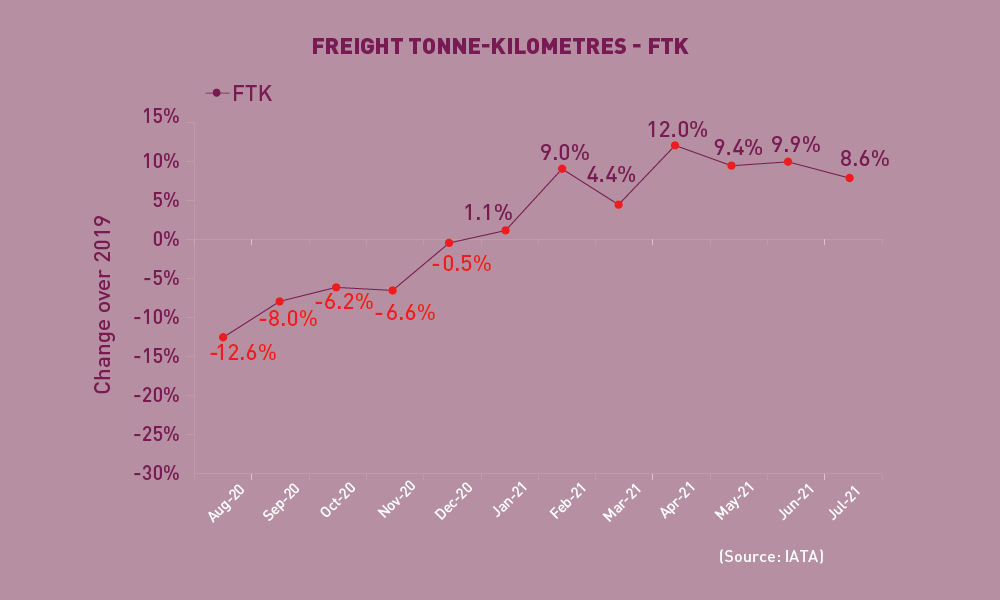
World freight traffic reported a growth of +8.6% in July 2021 (compared to 2019), -1.3 percentage points lower than the growth in the previous month. Despite a slight slowdown, the growth trend of air cargo remained strong broadly. The current state of supply chains and demand for businesses to restock inventories remains highly supportive to air cargo. Regional performance continued to vary from each other. North America and the Middle East posted the strongest growth double-digitally; Growth in Europe was solid although relatively moderate. For Asia/Pacific, the growth momentum started to show a sign of softening, while Latin America/Caribbean continued to be the only region posting negative growth.
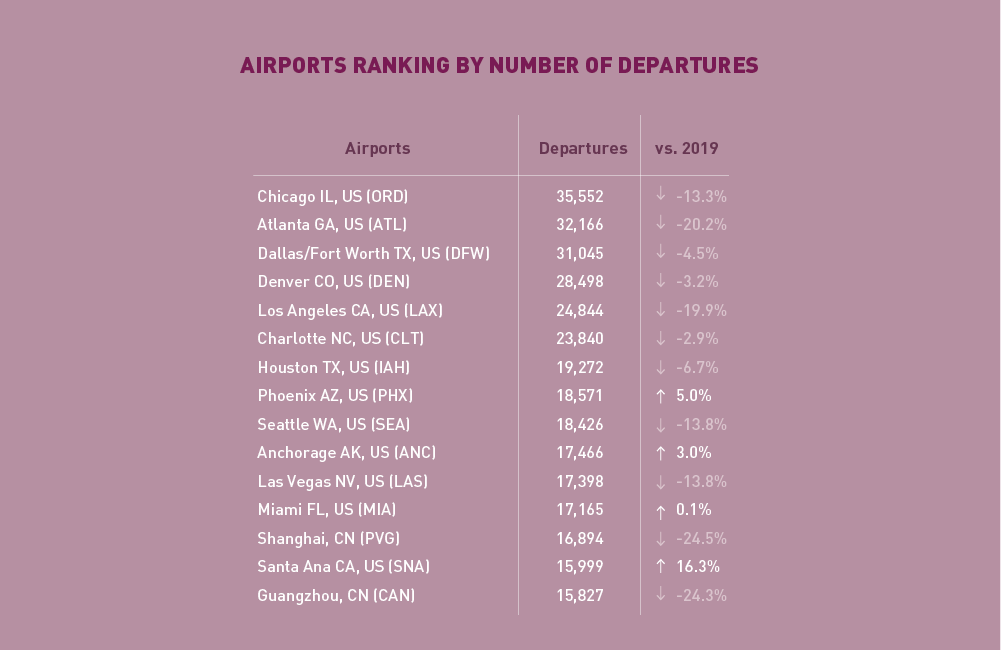
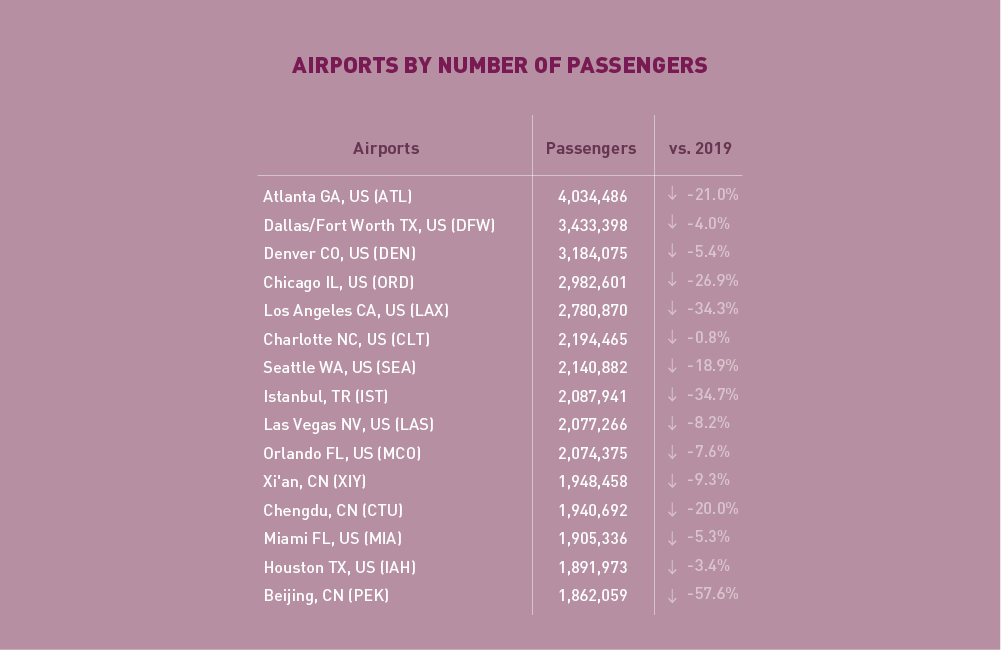
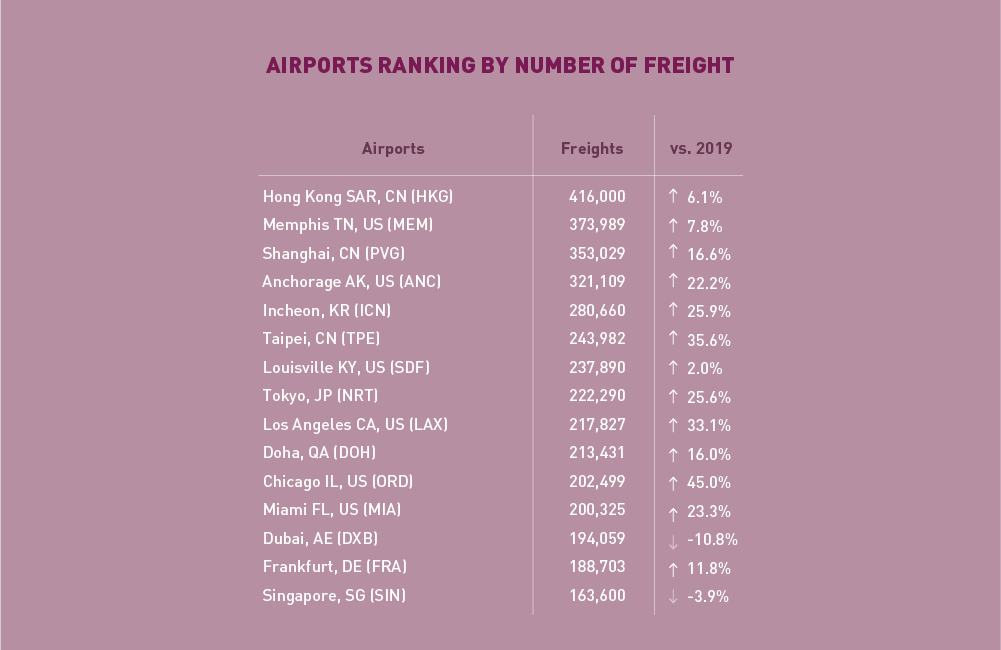
Top 15 Airports (Ranked by aircraft departures, passengers, and volume of freight)
Note: Figures include total scheduled and non-scheduled services
July 2021: -10.0%, -20.3%, and +15.2% (vs. 2019) in terms of aircraft departures, passengers and freight for the Top 15
Top 15 Airline Groups (Ranked by RPK)
July 2021: –40.1% (vs. 2019) in terms of RPK for the Top 15
In terms of RPK, the Top 15 airline groups accounted for 73.5% of the world’s total RPK in July 2021 and declined by –40.1% compared to 2019. This decline was 20.0 percentage points smaller than the fall in world’s average RPK. Airlines with large domestic markets continued to lead the growth chart.
US airlines retained the Top 4 positions, and continued to improve, owing to the traditional northern hemisphere summer peak travel and also the busy July 4 long holiday weekend. American maintained 1st with a decline of -19.5% compared to 2019. Delta, United and Southwest kept at 2nd, 3rd and 4th, respectively.
After the substantial deterioration in June, Chinese domestic travel demand regained the growth momentum as travel restrictions were eased gradually. All Chinese airlines in the Top 15 showed a smaller fall. China Southern, China Eastern maintained the position of 5th and 6th, while Air China improved 1 position to 7th.
Airlines in Europe demonstrated stronger recovery compared to the previous month, supported by the pick up of intra-European travel. Nevertheless, the three major airline groups, AF-KLM, Lufthansa and IAG recorded the largest contractions among the Top 15. Aeroflot and Turkish Airlines showed better performance owing to their domestic demand.
Qatar Airways returned to the Top 15 and ranked 14th, albeit posting a large decline of -56.5%.
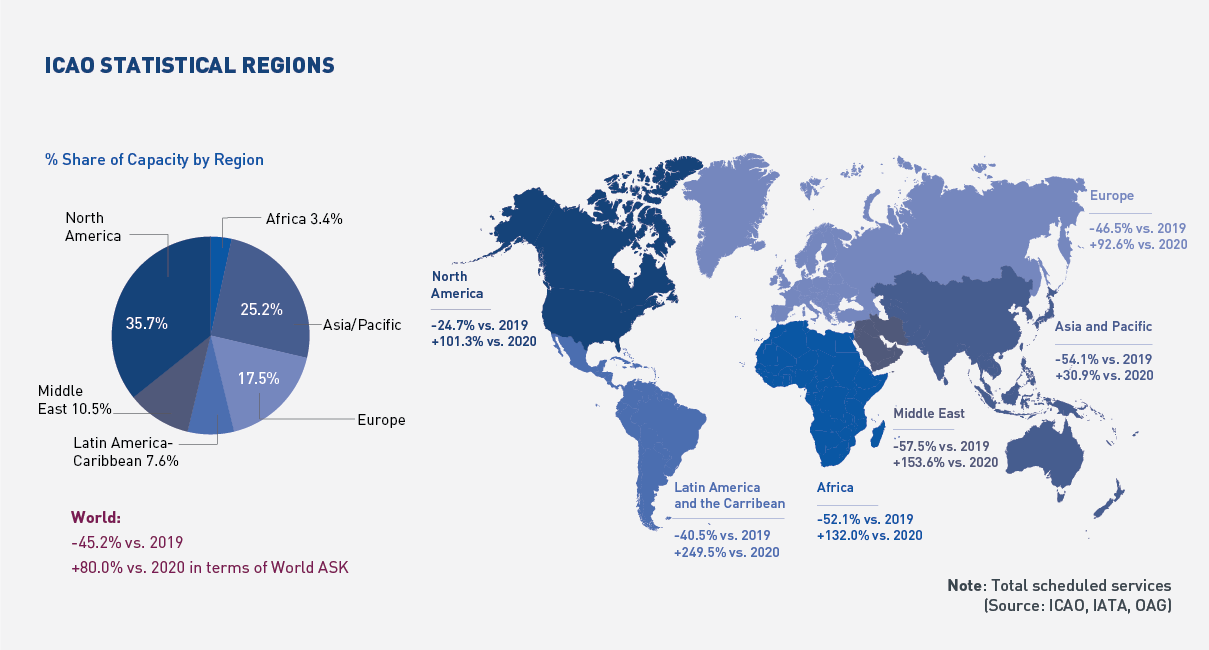
Worldwide capacity contracted by -45.2% in July 2021, compared to 2019. In line with the rising travel demand, seat capacity trended higher in all regions. The most significant increase was recorded by Europe as travel rebounded within Europe, both domestically and internationally. The Middle East also showed an increase benefiting from the slowly improving international travel demand.
Click here to download the Monthly Monitor in a PDF version.
For any queries for further information, please contact the ICAO Economic Development (ECD), Air Transport Bureau ecd@icao.int
Acronyms: ACI: Airports Council International; ASK: Available Seat-Kilometres; IATA: International Air Transport Association; FTK: Freight Tonne-Kilometres; LF: Passenger Load Factor; OAG: Official Airline Guide; RPK: Revenue Passenger-Kilometres; UNWTO: World Tourism Organization; YoY: Year-on-year; YTD: Year-to-date.