The air transport industry is not only a vital engine of global socio-economic growth, but it is also of vital importance as a catalyst for economic development. Not only does the industry create direct and indirect employment and support tourism and local businesses, but it also stimulates foreign investment and international trade.
Informed decision-making is the foundation upon which successful businesses are built. In a fast-growing industry like aviation, planners and investors require the most comprehensive, up-to-date, and reliable data. ICAO’s aviation data/statistics programme provides accurate, reliable and consistent aviation data so that States, international organizations, aviation industry, tourism and other stakeholders can:
- make better projections;
- control costs and risks;
- improve business valuations; and
- benchmark performance.
The UN recognized ICAO as the central agency responsible for the collection, analysis, publication, standardization, improvement and dissemination of statistics pertaining to civil aviation. Because of its status as a UN specialized agency, ICAO remains independent from outside influences and is committed to consistently offering comprehensive and objective data. Every month ICAO produces this Air Transport Monitor, a monthly snapshot and analysis of the economic and aviation indicators.
ECONOMIC DEVELOPMENT – April 2021
World Results and Analyses for February 2021
Total Scheduled Services (Domestic and International)
Passenger traffic
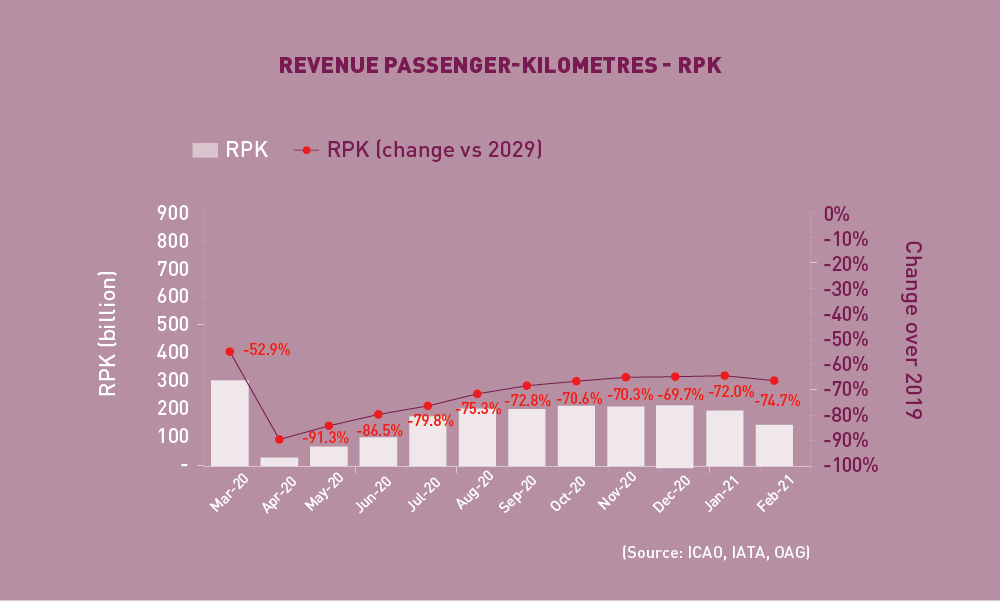
Revenue Passenger-Kilometres – RPK
World passenger traffic fell by -74.7% in February 2021 (compared to 2019), -2.7 percentage points lower than the decline in the previous month. Surging new COVID-19 cases along with stringent travel restrictions have caused further deterioration in both international and domestic traffic. All regions contributed to the global weakness, with Asia/Pacific and Europe recording the largest slowdown. While improvements were observed in domestic Australia and the US, most major domestic markets trended downward, particularly domestic China which marked a slump.
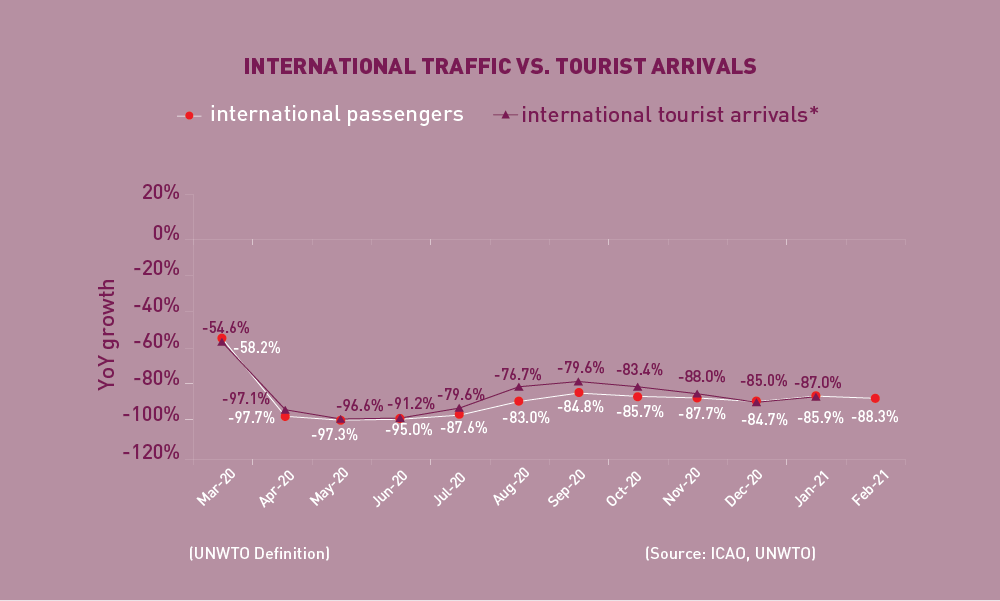
International Traffic vs. Tourist Arrivals
International passenger numbers fell by -88.3% in February 2021 (compared to 2019), -3.3 percentage points down from the decline in the previous month. Travel restrictions remained strict, and international traffic worsened for all regions, particularly Europe and Latin America/Caribbean.
The international tourist arrivals also remained stagnant and followed a similar trend as international passenger traffic.
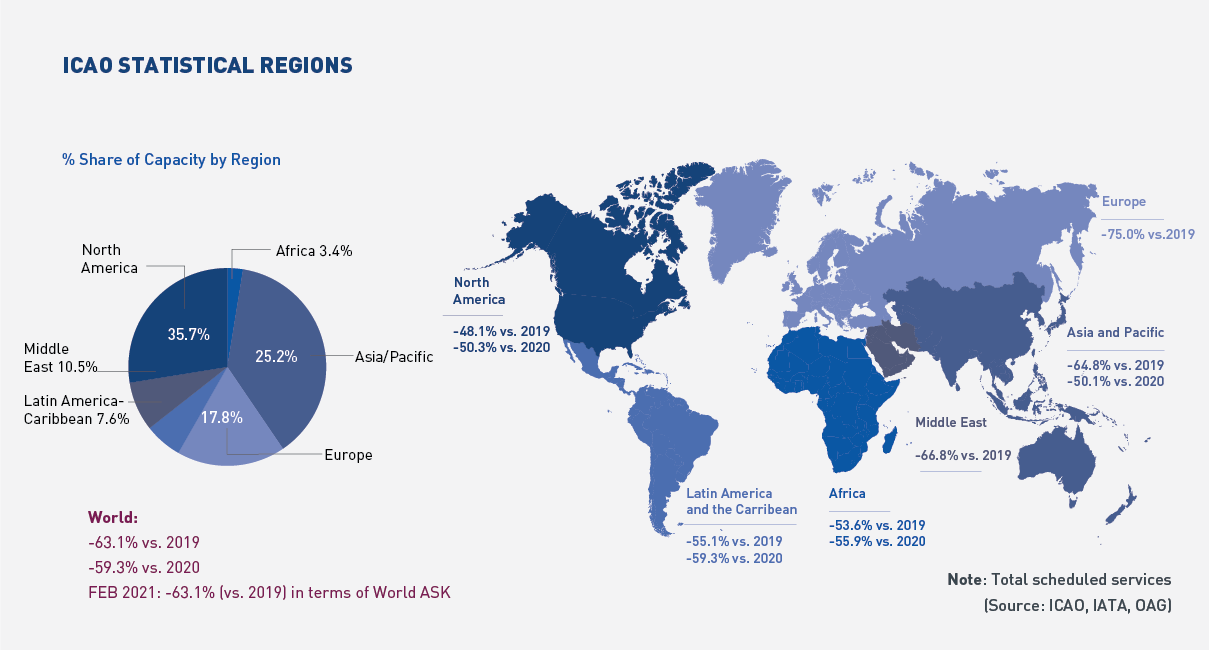
Capacity
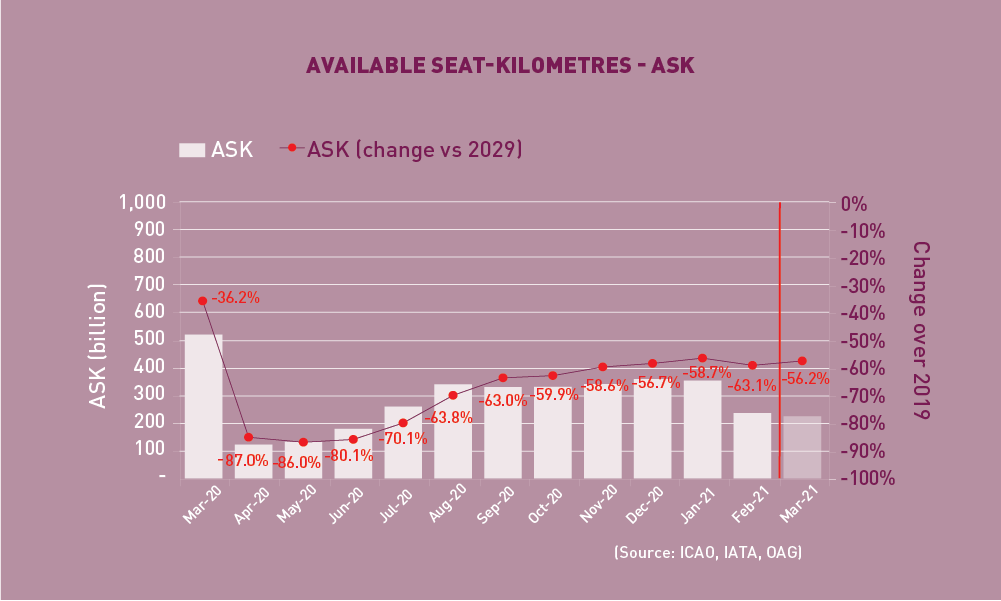
Available Seat-Kilometres – ASK
Capacity worldwide fell by -63.1% in February 2021 (compared to 2019), -4.4 percentage points down from the decline in the previous month (-58.7%). With signs of easing pressure on domestic travel, capacity is likely to be restored in March 2021 reaching a fall of -56.2% from the 2019 level.
Load Factor
The passenger Load Factor reached 55.4% in February 2021, +1.3 percentage points higher than the previous month. As air travel demand fell faster than capacity, the February LF was -25.2 percentage points lower than the rate in the same period of 2019.
Freight Traffic
Freight Tonne-Kilometres – FTK
World freight traffic reported a growth of +9.0% in February 2021 (compared to 2019), +7.9 percentage points up from the growth in the previous month. In contrast to passenger traffic, freight traffic continued to rise sharply, despite the intensified pandemic situation. Air cargo demand remained strong, supported by the robust developments in manufacturing and goods trade during the global economic recovery. All regions, except for Latin America/Caribbean, showed expansion in freight traffic. Africa recorded the fastest growth and topped the growth chart, followed by North America, which also expanded double-digitally. Latin America/Caribbean continued to lag behind other regions and was the only region with a decline from the 2019 levels.
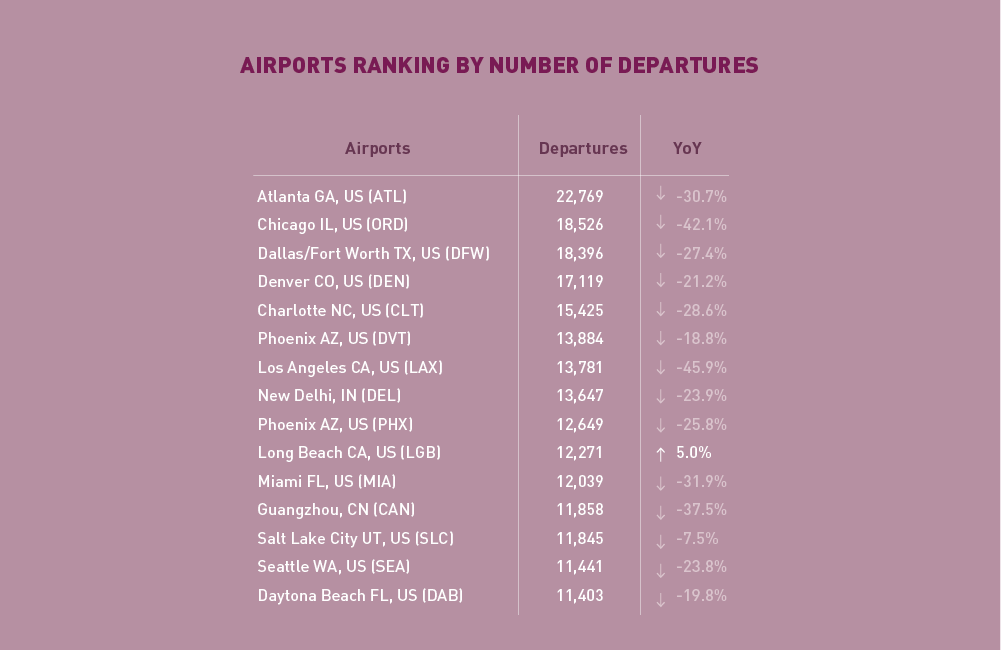
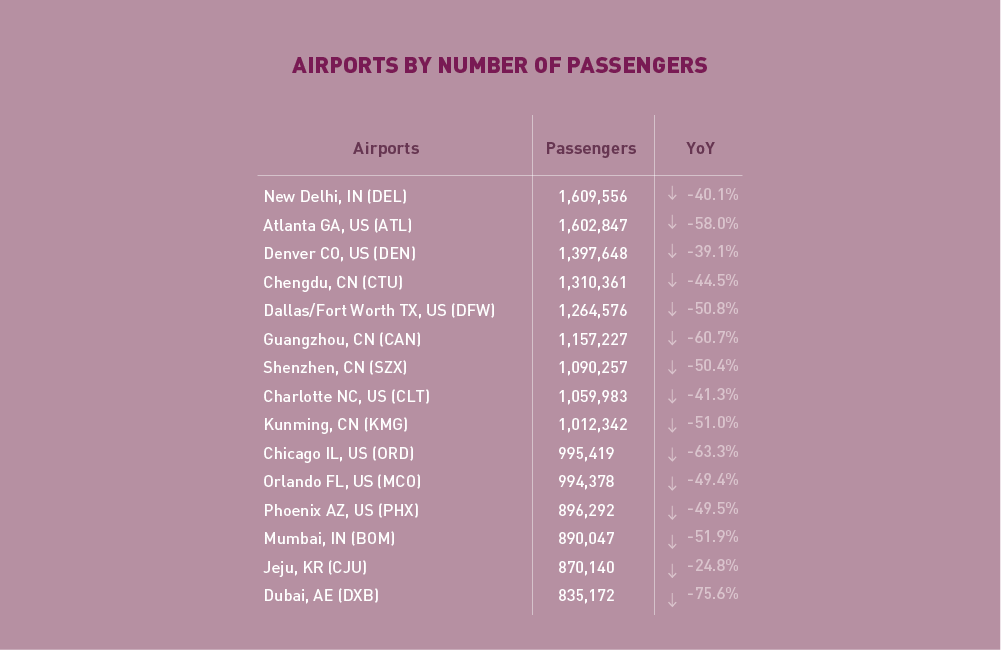
Top 15 Airports (Ranked by aircraft departures, passengers, and volume of freight)
Note: Figures include total scheduled and non-scheduled services
February 2021: –28.0%, -52.3%, and +19.6% (vs. 2019) in terms of aircraft departures, passengers and freight for the Top 15
In terms of passengers, the Top 15 airports posted a total fall of -52.3%, compared to 2019. Rankings changed significantly in February. In addition to the US and Chinese, a few airports in Asia/Pacific and the Middle East also appeared in the list. For the first time, New Delhi became 1st, albeit with a large YoY decline. The smallest fall was posted by Jeju (-24.8%) and Denver (-39.1%).
In terms of freight, the Top 15 airports reported a YoY increase of +19.6%, compared to 2019. Freight traffic continued to expand strongly. All Top 15 recording YoY growth, except for Memphis (-14.9%), Dubai (-14.0%) and Paris (-0.9%). Hong Kong retained the 1st position, while the largest expansion was recorded by Chicago at +62.2%.
Top 15 Airline Groups (Ranked by RPK)
February 2021: –70.2% (vs. 2019) in terms of RPK for the Top 15
In terms of RPK, the Top 15 airline groups accounted for 62.9% of the world’s total RPK in February 2021 and declined by –70.2% compared to 2019. This decline was 4.5 percentage points smaller than the fall in world’s average RPK, with all airlines in the Top 15 posting contractions.
February marked another month of deterioration in both international and domestic traffic. All airlines in the Top 15 recorded smaller RPKs compared to January, especially the Chinese airlines, due to the abrupt fall in domestic traffic.
For the second consecutive month, the three major US airlines maintained the Top 3 positions. American ranked 1st, followed by Delta and United. Southwest improved one position to 7th. In average, all the US airlines in the Top 15 have recovered to around 35% of 2019 traffic levels.
The Chinese airlines in the Top 15, China Southern, China Eastern, Air China, and Hainan Airlines, posted sharp declines in traffic, driven by the limited travel during the Chinese New Year period. Compared to January, the Chinese airlines recorded 16-25% lower traffic. While the former three kept the same positions, the latter dropped one position to 10th.
Airlines in Europe further trended downward. AF-KLM went down to 8th, while Aeroflot and Turkish Airlines climbed up to 9th and 11th. Lufthansa ranked 15th and recorded the second-largest fall.
Both Emirates and LATAM posted deeper decline and ranked 13th and 14th, respectively.
Worldwide capacity contracted by -63.1% in February 2021, compared to 2019. Capacity offered in all regions was reduced, except for small increases in North America and Africa where travel restrictions eased slightly.
Europe continued to see the largest capacity decrease, followed by Asia/Pacific, mainly attributed to the fall in domestic China.
Click here to download the Monthly Monitor April PDF version.
For any queries for further information, please contact the ICAO Economic Development (ECD), Air Transport Bureau ecd@icao.int
Acronyms: ACI: Airports Council International; ASK: Available Seat-Kilometres; IATA: International Air Transport Association; FTK: Freight Tonne-Kilometres; LF: Passenger Load Factor; OAG: Official Airline Guide; RPK: Revenue Passenger-Kilometres; UNWTO: World Tourism Organization; YoY: Year-on-year; YTD: Year-to-date.