The air transport industry is not only a vital engine of global socio-economic growth, but it is also of vital importance as a catalyst for economic development. Not only does the industry create direct and indirect employment and support tourism and local businesses, but it also stimulates foreign investment and international trade.
Informed decision-making is the foundation upon which successful businesses are built. In a fast-growing industry like aviation, planners and investors require the most comprehensive, up-to-date, and reliable data. ICAO’s aviation data/statistics programme provides accurate, reliable and consistent aviation data so that States, international organizations, the aviation industry, tourism and other stakeholders can:
- make better projections;
- control costs and risks;
- improve business valuations; and
- benchmark performance.
The UN recognized ICAO as the central agency responsible for the collection, analysis, publication, standardization, improvement and dissemination of statistics pertaining to civil aviation. Because of its status as a UN specialized agency, ICAO remains independent from outside influences and is committed to consistently offering comprehensive and objective data. Every month ICAO produces this Air Transport Monitor, a monthly snapshot and analysis of the economic and aviation indicators.
ECONOMIC DEVELOPMENT – January 2022
World Results and Analyses for November 2021
Total Scheduled Services (Domestic and International)
Passenger traffic
World passenger traffic fell by -47.0% in November 2021 (compared to 2019), +6.4 percentage points up from the decline in the previous month. Air travel recovery continued after a slight dip in September. Domestic air travel deteriorated, mainly due to the larger fall in Chinese domestic as a result of the imposition of stricter travel restrictions. The emergence of the Omicron variants at the end of the month may stall the steady travel recovery trend, while on the positive side, demand for the holiday travel is likely to be strong.
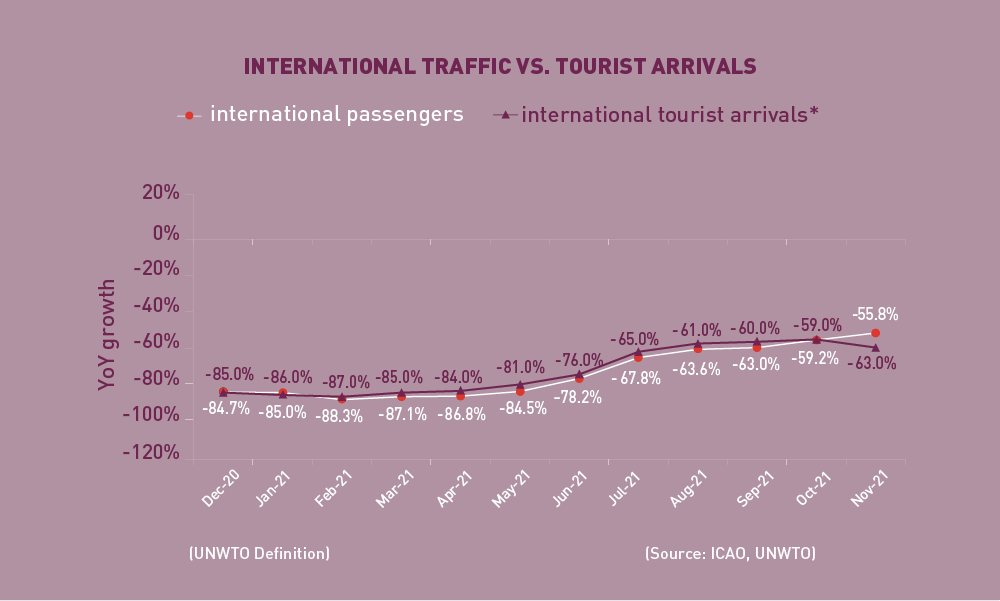
International passenger numbers fell by -55.8% in November 2021 (compared to 2019), +3.4 percentage points up from the decline in the previous month. All regions showed improvements, particularly in North America and Latin America/Caribbean. Compared to air travel, the recovery in international tourist arrivals weakened amid the low tourism season.
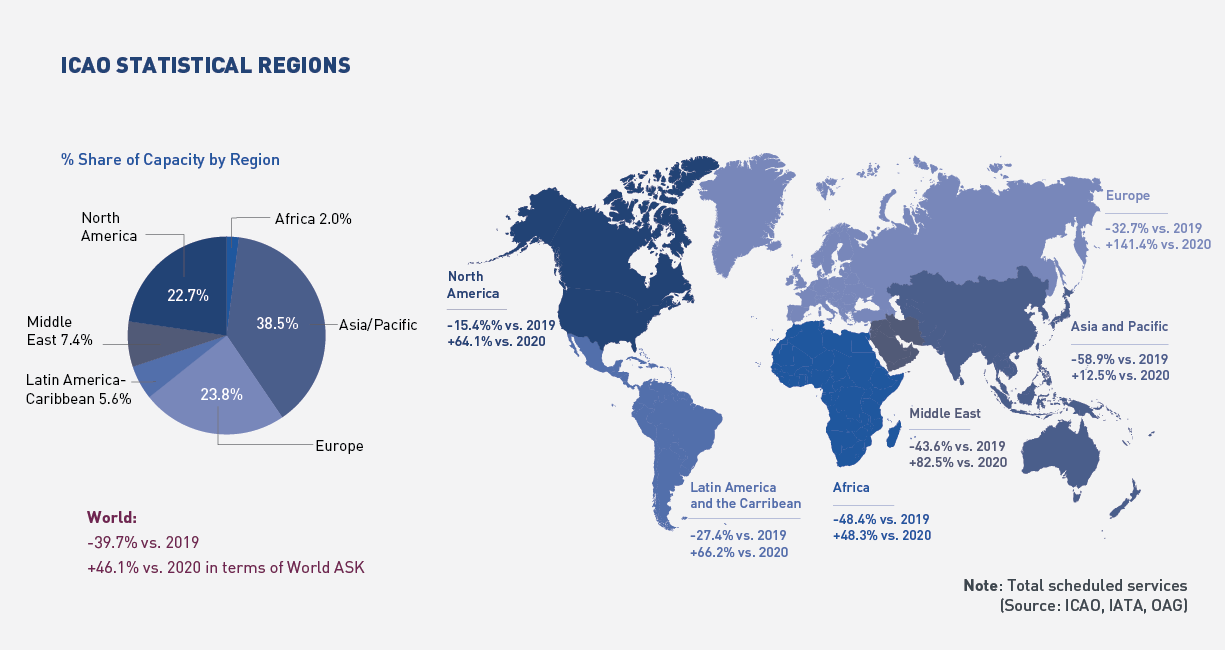
Capacity
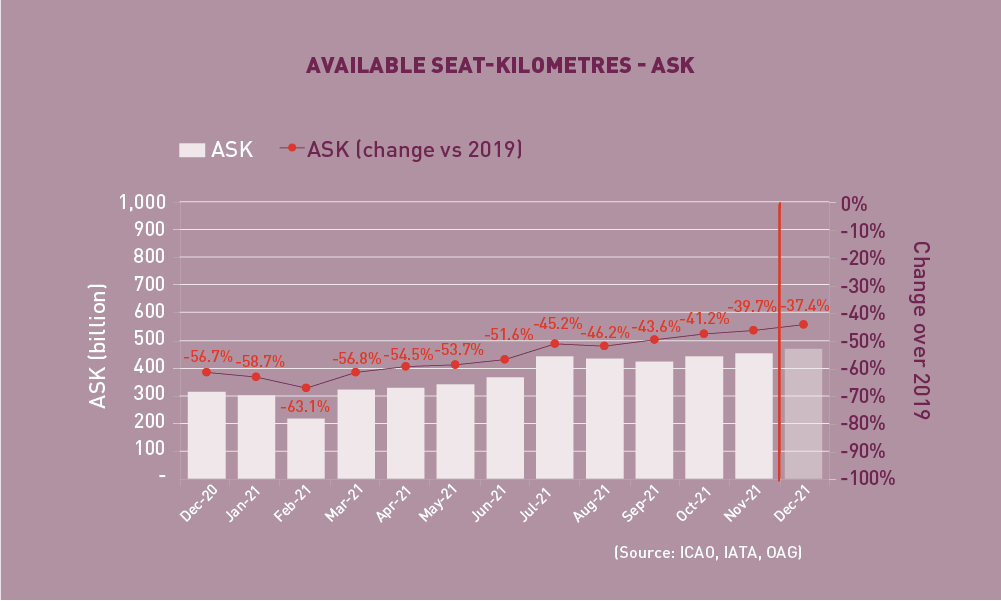
Capacity worldwide fell by -39.7% in November 2021 (compared to 2019), +1.5 percentage points up from the decline in the previous month (-41.2%). As the holiday season approaches, airlines are expected to add back capacity gradually. The December capacity is expected to improve to –37.4% down from the 2019 level.
Load Factor
The passenger Load Factor reached 71.3% in November 2021, +0.7 percentage points higher than the previous month. Load factor improved slightly as air travel demand increased more than capacity. Despite the improvement, the November LF remained -8.8 percentage points below the 2019 level.
Freight Traffic
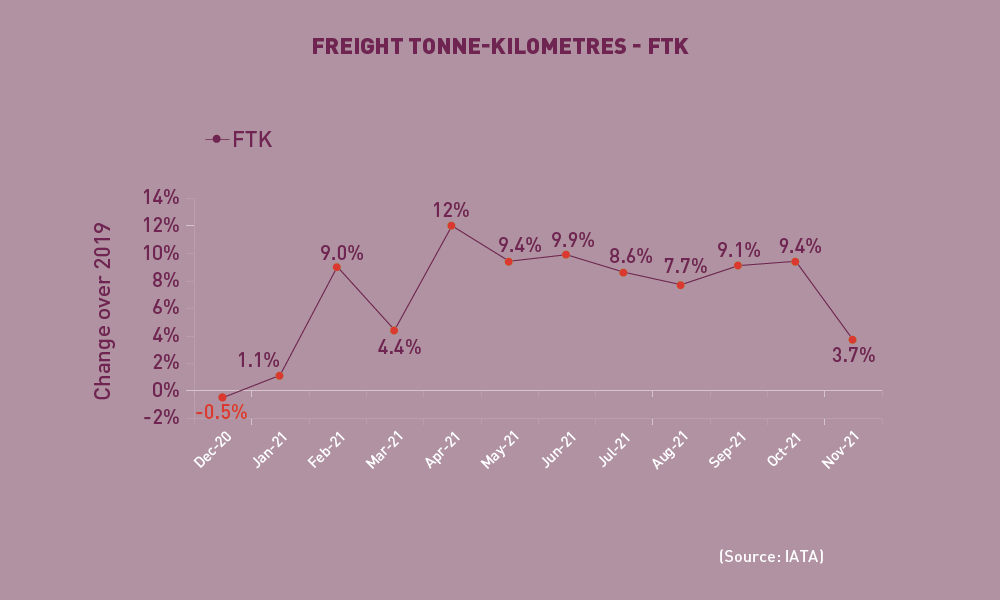
World freight traffic reported a growth of +3.7% in November 2021 (compared to 2019), -5.7 percentage points down from the growth in the previous month. After months of strong expansion, air cargo growth experienced a significant slowdown. This weakened performance was unexpected considering that November is usually a peak period for air cargo owing to the major year-end consumer events. The softening was widespread across all regions, particularly in Africa, which saw a remarkable deterioration from double-digit rise to negative growth. Latin America/Caribbean continued to be the weakest performing region with further worsened decline. North America maintained a double-digit growth and demonstrated the most resilience.
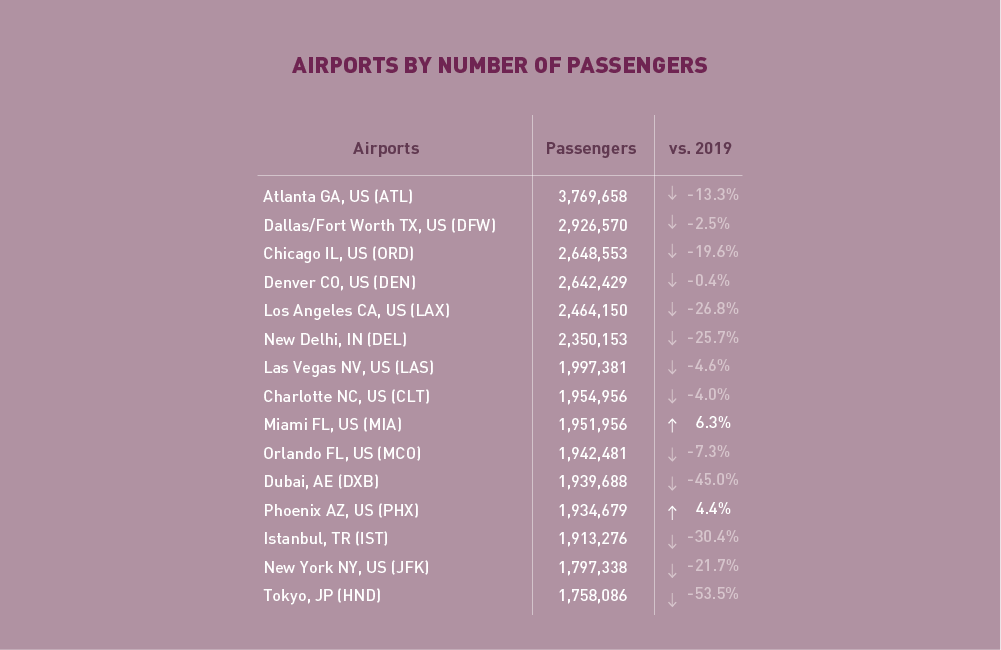
Top 15 Airports (Ranked by aircraft departures, passengers, and volume of freight)
Note: Figures include total scheduled and non-scheduled services
November 2021: –9.4%, -19.2%, and +11.4% (vs. 2019) in terms of aircraft departures, passengers and freight for the Top 15
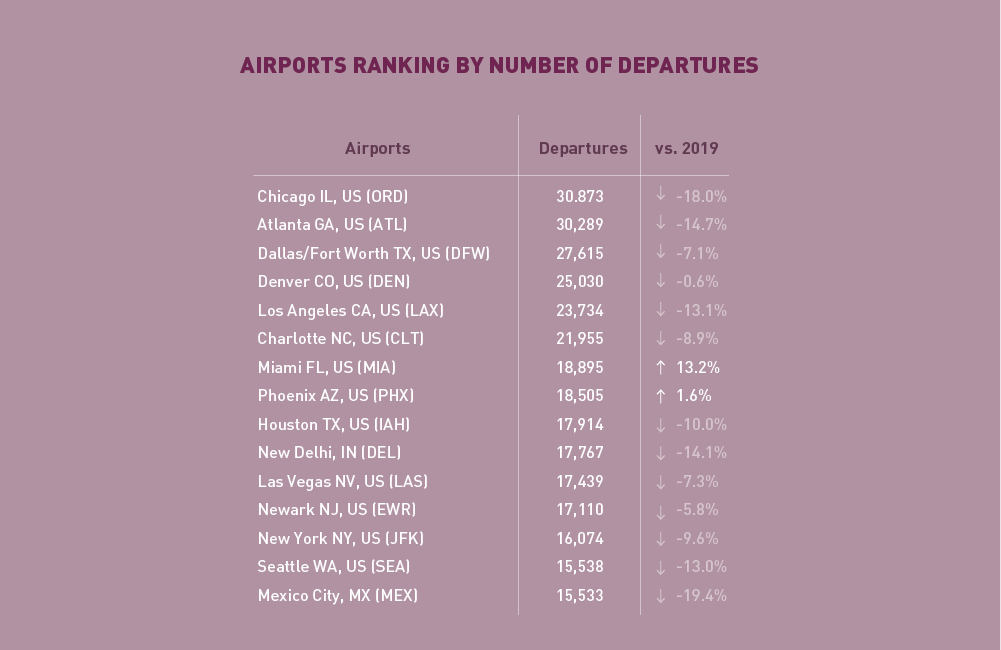
In terms of aircraft departures, the Top 15 airports reported a combined fall of -9.4%, compared to 2019. All but two of the Top 15 airports were US airports. Chicago remained 1st with a decline of -18.0%. For the first time, Mexico City made it to the Top 15 albeit with the largest fall of -19.4%. Miami and Phoenix were the only airports posting increases.
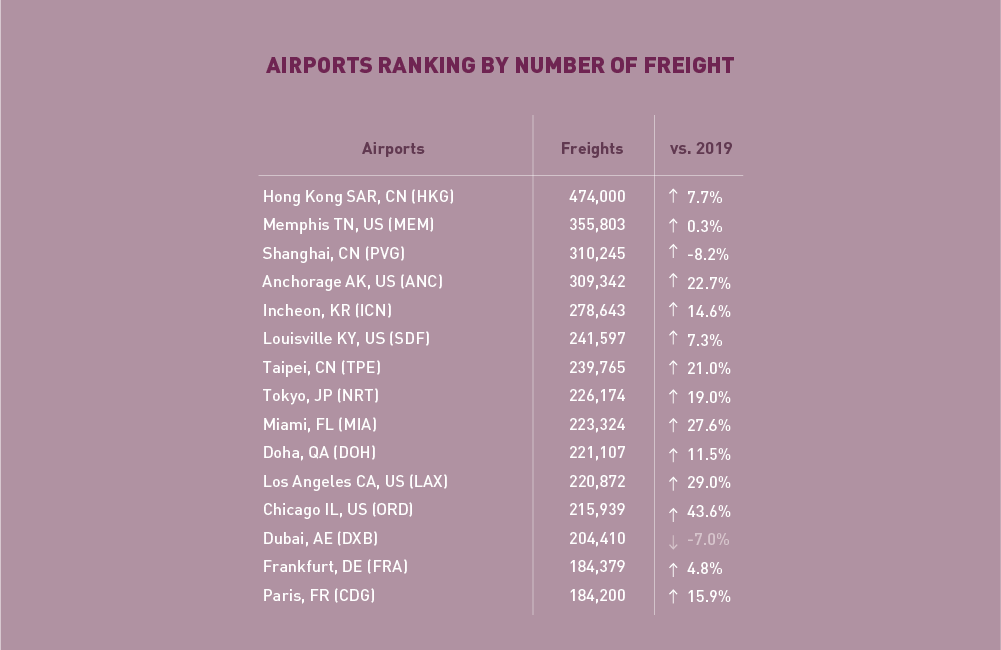
In terms of freight, the Top 15 airports reported an increase of +11.4%, compared to 2019. Nine out of the Top 15 airports grew double-digitally, with the strongest increase in Chicago (+43.6%). Hong Kong remained at 1st with a solid growth of +7.7%. Shanghai and Dubai continued to post declines for the third consecutive month.
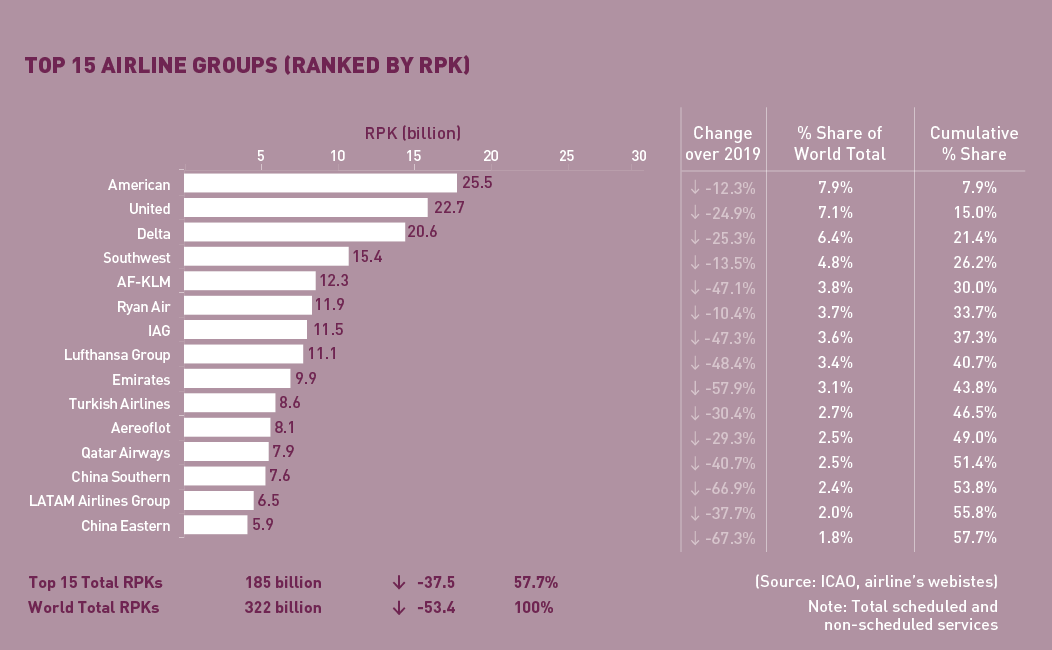
Top 15 Airline Groups (Ranked by RPK)
In terms of RPK, the Top 15 airline groups accounted for 57.7% of the world’s total RPK in November 2021 and declined by –37.5% compared to 2019. This decline was 15.9 percentage points smaller than the fall in world’s average RPK. November marked another month of a shift in positions, largely driven by significant swings in traffic in major domestic markets, particularly China.
US airlines retained the Top 4 positions with American at 1st, followed by United, Delta and Southwest. Among the four, American and Southwest continued to post smaller declines.
After a modest pick-up, domestic passenger traffic in China deteriorated substantially due to the tightened travel restriction against the renewed outbreaks. Only two airline groups, China Southern and China Eastern remained in the Top 15, at 13th and 15th, respectively.
European airlines continued to show improvements on the back of easing travel restrictions. The most noticeable rise was recorded by Ryanair, which jumped 4 places to 6th. AF-KLM and IAG improved 2 and 1 positions, respectively, while Lufthansa dropped 2 positions to 8th.
Owing to the steady recovery in international travel, Emirates and Qatar moved up 5 and 3 positions to 9th and 12th, respectively. For the first time in the past two years, LATAM re-appeared in the Top 15 group and ranked 14th.
Capacity by Region
Click here to download the Monthly Monitor in a PDF version.
For any queries for further information, please contact the ICAO Economic Development (ECD), Air Transport Bureau ecd@icao.int
Acronyms: ACI: Airports Council International; ASK: Available Seat-Kilometres; IATA: International Air Transport Association; FTK: Freight Tonne-Kilometres; LF: Passenger Load Factor; OAG: Official Airline Guide; RPK: Revenue Passenger-Kilometres; UNWTO: World Tourism Organization; YoY: Year-on-year; YTD: Year-to-date.