The air transport industry is not only a vital engine of global socio-economic growth, but it is also of vital importance as a catalyst for economic development. Not only does the industry create direct and indirect employment and support tourism and local businesses, but it also stimulates foreign investment and international trade.
Informed decision-making is the foundation upon which successful businesses are built. In a fast-growing industry like aviation, planners and investors require the most comprehensive, up-to-date, and reliable data. ICAO’s aviation data/statistics programme provides accurate, reliable and consistent aviation data so that States, international organizations, the aviation industry, tourism and other stakeholders can:
- make better projections;
- control costs and risks;
- improve business valuations; and
- benchmark performance.
The UN recognized ICAO as the central agency responsible for the collection, analysis, publication, standardization, improvement and dissemination of statistics pertaining to civil aviation. Because of its status as a UN specialized agency, ICAO remains independent from outside influences and is committed to consistently offering comprehensive and objective data. Every month ICAO produces this Air Transport Monitor, a monthly snapshot and analysis of the economic and aviation indicators.
ECONOMIC DEVELOPMENT – December 2021
World Results and Analyses for October 2021
Total Scheduled Services (Domestic and International)
Passenger traffic
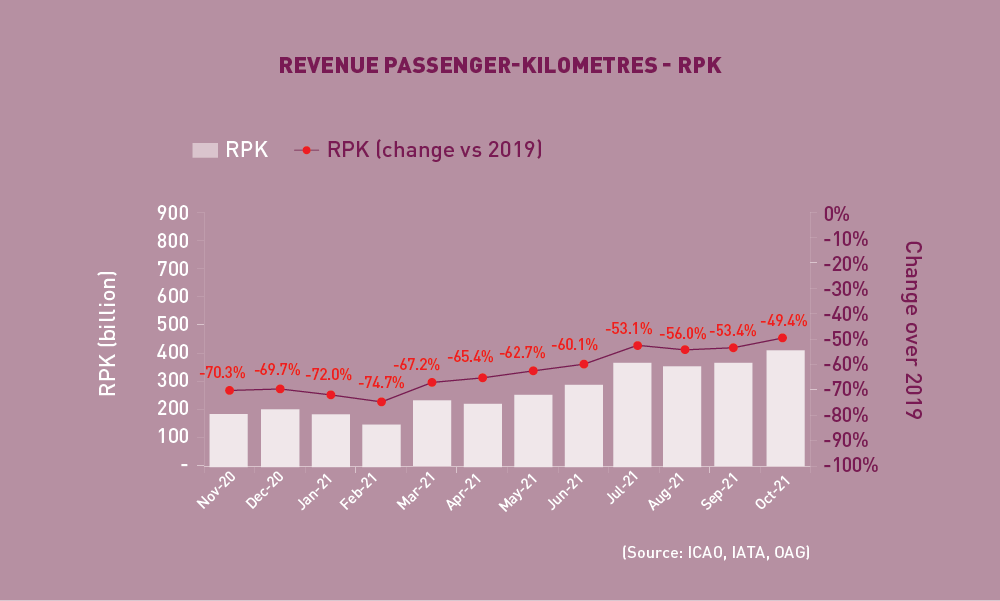
World passenger traffic fell by -49.4% in October 2021 (compared to 2019), +4.0 percentage points up from the decline in the previous month. Recovery in air travel progressed slightly, supported by the rising vaccination rates and stabilization in new infections. Nonetheless, risk of outbreak resurgence remains and poses significant uncertainty to a steady recovery in the coming months. Domestic market of the Russian Federation demonstrated the most resilience, which has exceeded the pre-crisis levels since the beginning of the year.
International passenger numbers fell by -59.2% in October 2021 (compared to 2019), +3.8 percentage points up from the decline in the previous month. Owing to the easing travel restrictions, international travel recovered in all regions, particularly in Europe and the Middle East. The recovery in international tourist arrivals is expected to follow a similar trend as international passenger traffic.
Capacity
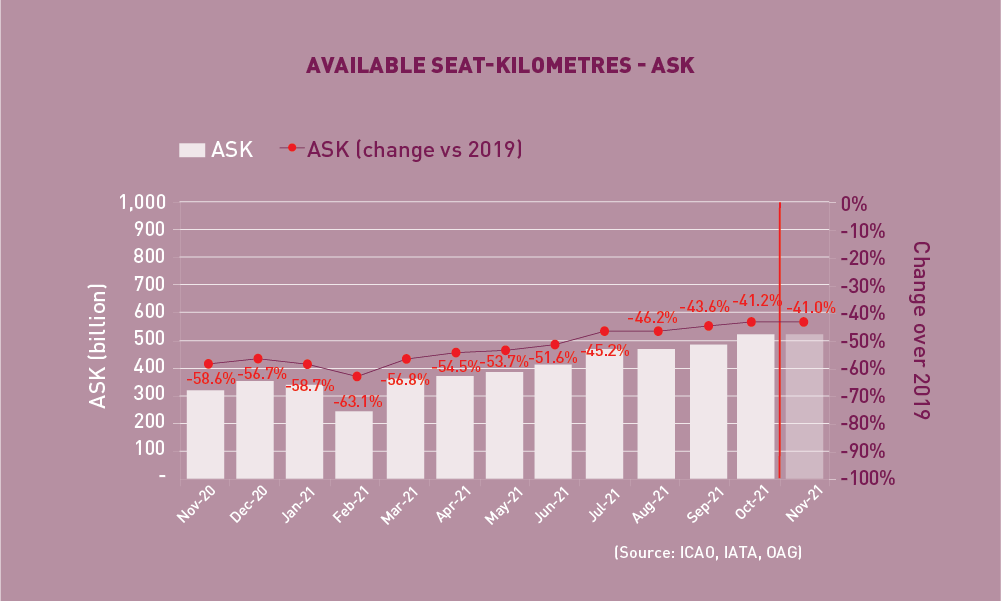
Capacity worldwide fell by -41.2% in October 2021 (compared to 2019), +2.4 percentage points up from the decline in the previous month (-43.6%). As airlines have been cautious in adding back capacity, the November capacity is expected to stay at –41.0% down from the 2019 levels.
Load Factor
Freight Traffic
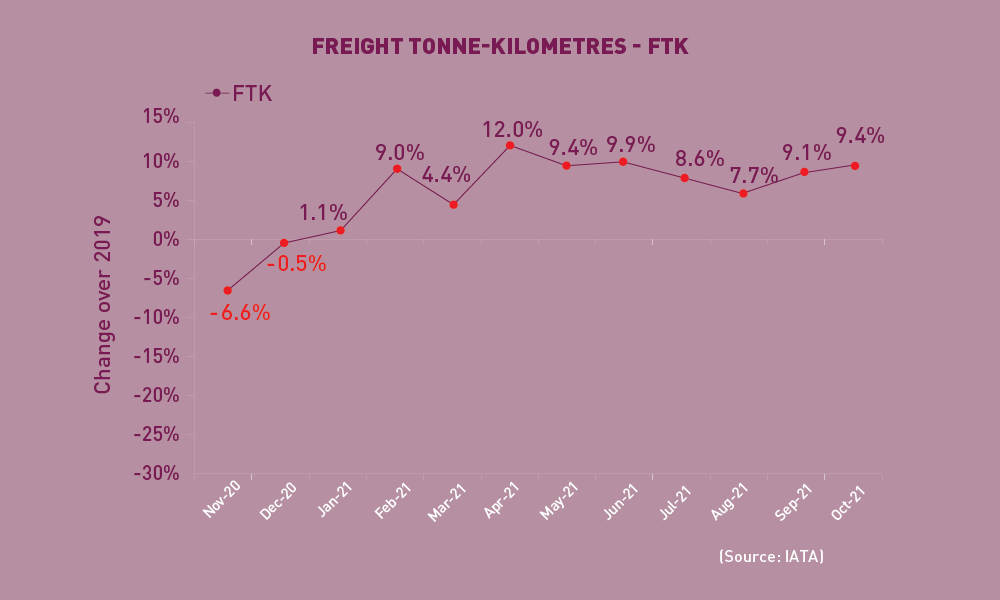
World freight traffic reported a growth of +9.4% in October 2021 (compared to 2019), +0.3 percentage points up from the growth in the previous month. Air cargo continued to benefit from the the supply chain congestion which has caused temporary shift of freight from sea to air. To meet the strong demand of the upcoming major year-end consumer events, businesses and shippers are likely to favor air cargo over other modes of air transport. Performance diverged across regions. While Asia/Pacific and Europe were the main contributors to the improvement of this month, traffic in Africa and the Middle East deteriorated. Latin America/Caribbean improved significantly, however, it remained the only region posting contraction from the 2019 levels.
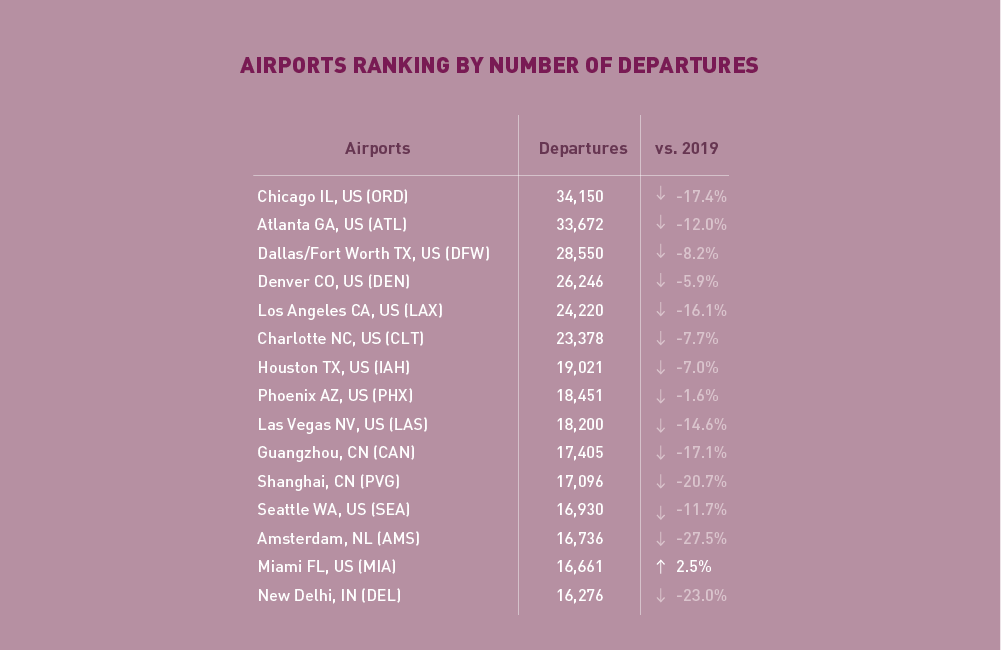
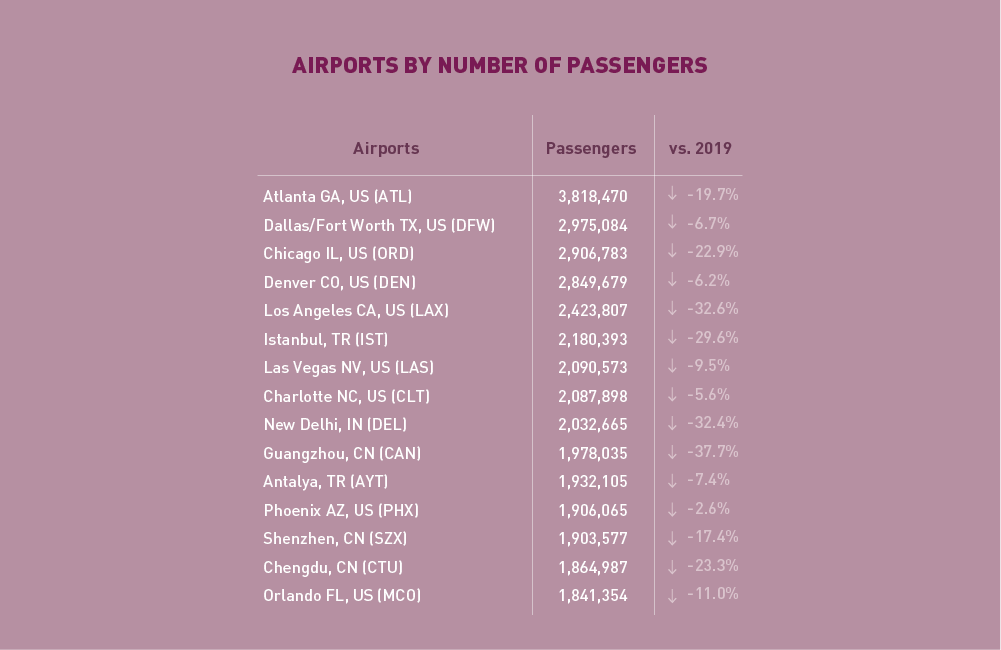
Top 15 Airports (Ranked by aircraft departures, passengers, and volume of freight)
Note: Figures include total scheduled and non-scheduled services
October 2021: -40.7% (vs. 2019) in terms of RPK for the Top 15
Top 15 Airline Groups (Ranked by RPK)
In terms of RPK, the Top 15 airline groups accounted for 60.7% of the world’s total RPK in October 2021 and declined by –40.7% compared to 2019. This decline was 12.7 percentage points smaller than the fall in world’s average RPK.
Compared to September, the Top 15 ranking was relatively stable with a small shift in positions, mostly among the European airlines. US airlines retained the Top 4 positions with American ranked 1st, followed by Delta, United and Southwest. As it has been the case in the previous months, American and Southwest posted much smaller declines from 2019 levels.
The domestic passenger traffic in China picked up but at a slow pace, as travel restrictions remained strict. The three major Chinese airlines, China Southern, Air China and China Eastern maintained the same positions of 5th, 12th and 13th. International travel continued to be supportive to European airlines on the back of easing travel restrictions. Lufthansa kept the 6th place, while AF-KLM and IAG improved 1 position to 7th and 8th, respectively.
Qatar Airways and Emirates maintained the last two positions within the Top 15, with the latter recording the largest contraction from 2019 levels.
Capacity by Region (ICAO Statistical Regions)
Click here to download the Monthly Monitor in a PDF version.
For any queries for further information, please contact the ICAO Economic Development (ECD), Air Transport Bureau ecd@icao.int
Acronyms: ACI: Airports Council International; ASK: Available Seat-Kilometres; IATA: International Air Transport Association; FTK: Freight Tonne-Kilometres; LF: Passenger Load Factor; OAG: Official Airline Guide; RPK: Revenue Passenger-Kilometres; UNWTO: World Tourism Organization; YoY: Year-on-year; YTD: Year-to-date.