The air transport industry is not only a vital engine of global socio-economic growth, but it is also of vital importance as a catalyst for economic development. Not only does the industry create direct and indirect employment and support tourism and local businesses, but it also stimulates foreign investment and international trade.
Informed decision-making is the foundation upon which successful businesses are built. In a fast-growing industry like aviation, planners and investors require the most comprehensive, up-to-date, and reliable data. ICAO’s aviation data/statistics programme provides accurate, reliable and consistent aviation data so that States, international organizations, aviation industry, tourism and other stakeholders can:
- make better projections;
- control costs and risks;
- improve business valuations; and
- benchmark performance.
The UN recognized ICAO as the central agency responsible for the collection, analysis, publication, standardization, improvement and dissemination of statistics pertaining to civil aviation. Because of its status as a UN specialized agency, ICAO remains independent from outside influences and is committed to consistently offering comprehensive and objective data. Every month ICAO produces this Air Transport Monitor, a monthly snapshot and analysis of the economic and aviation indicators.
ECONOMIC DEVELOPMENT – September 2020
World Results and Analyses for July 2020
Total Scheduled Services (Domestic and International)
Passenger traffic
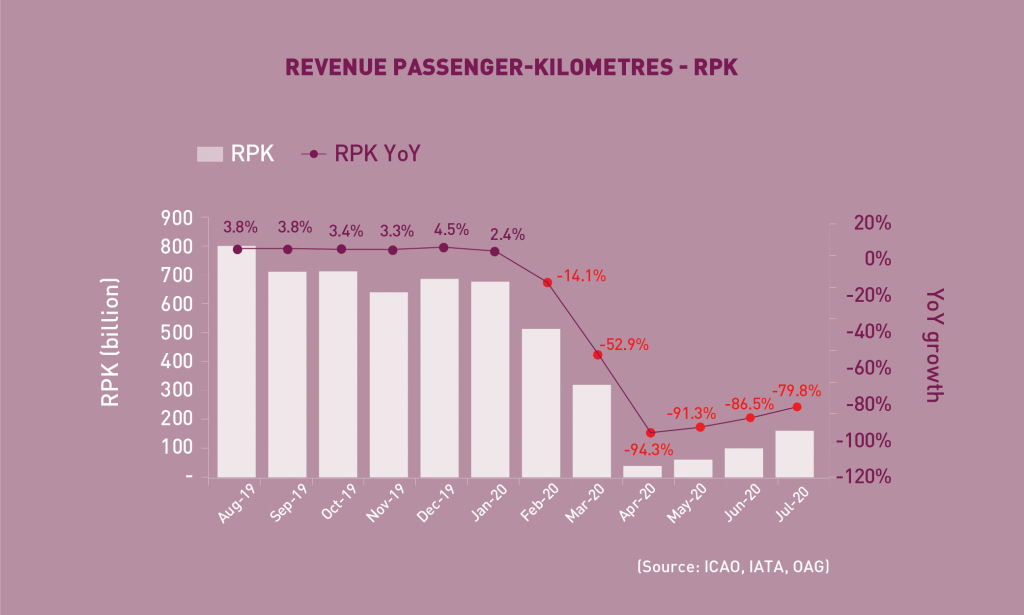
Revenue Passenger-Kilometres – RPK
World passenger traffic fell by -79.8% YoY in July 2020, +6.7 percentage points up from the decline in the previous month. All regions showed gradual recovery at varying paces, with more significant improvements in Asia/Pacific, Europe and North America. Domestic travel continued to be the main driver for air traffic recovery, with smaller contractions in major markets, noticeably in China and the Russian Federation. Globally, the return of traffic is anticipated to remain slow due to the weak consumer confidence along with the unstable epidemic situation.

International Traffic vs. Tourist Arrivals
International passenger traffic fell by -91.9% YoY in July 2020, +4.9 percentage points up from the decline in the previous month. International air travel demand remained broadly sluggish for all regions, with the exception of Europe owing to the increasing intra-regional travel within the Schengen Area. The international tourist arrivals remained stagnant and are expected to follow a similar trend as international passenger traffic.
Capacity

Available Seat-Kilometres – ASK
Capacity worldwide fell by -70.1% YoY in July 2020, +10.0 percentage points up from the decline in the previous month (-80.1%). With more countries relaxing travel restrictions during the summer period and more airlines restarting operation, contraction in world capacity is expected to ease in August to -62.0% down YoY.

Load Factor
The passenger Load Factor reached 57.9% in July 2020, +0.3 percentage point higher than the previous month.
As rebound in capacity outpaced recovery in air travel demand, the July LF was -27.8 percentage points lower than the rate in the same period of 2019.
Freight Traffic

Freight Tonne-Kilometres – FTK
World freight traffic reported a decline of -13.5% YoY in July 2020, +4.1 percentage points up from the fall in the previous month. Recovery pace in air cargo continued to be steady since April, almost depicting a ‘Nike swoosh’-shaped path. The recent signs of improving economic activities and consumption of goods provide some optimisms for air cargo demand in the coming months. The current reduction in passenger flights and the consequential crunch in cargo capacity might lead to increased utilization of all-freighters and cargo-only operations. Wide disparity in recovery was observed amongst regions, with North America demonstrating the most resilience and being the only region recording a positive growth. Asia/Pacific, Europe and the Middle East posted modest upturn while deterioration was shown in Latin America/Caribbean.
Top 15 Airports (Ranked by aircraft departures, passengers and volume of freight)
Note: Figures include total scheduled and non-scheduled services
July 2020: -32.8%, -45.6%, and +2.8% YoY in terms of aircraft departures, passengers and freight for the Top 15

In terms of aircraft departures, all the Top 15 airports reported declines with a total fall of -32.8% YoY. Nine US and six Chinese airports ranked in the Top 15. Dallas/Fort Worth ranked 1st for the first time of the year, followed by Chicago and Atlanta. Stronger recovery was observed in Chinese airports, with Shenzhen and Chengdu posting the smallest declines of less than -10% YoY.

In terms of passengers, the Top 15 airports posted a decline of -45.6% YoY. The Top 15 was dominated by airports in the two largest domestic markets, China and US. Top 3 remained as the Chinese airports, and Guangzhou overtook Chengdu becoming 1st. The most significant declines were reported by Atlanta (-75.2%) and Chicago (-74.8%). Similar to departures, Chinese airports posted smaller fall.

In terms of freight, the Top 15 airports reported a YoY increase of +2.8%. This was the second consecutive growth since June. Over half of the Top 15 posted YoY increase with the strongest growth recorded by Memphis (+18.5%), which also remained at 1st. Hong Kong continued to be 2nd albeit with a fall of -5.9%, followed by Shanghai (+1.3%).
Top 15 Airline Groups (Ranked by RPK)

July 2020: -73.7% YoY in terms of RPK for the Top 15
In terms of RPK, the Top 15 airline groups accounted for 57.5% of the world’s total RPK in July 2020 and declined by -73.7% YoY. This decline was 6.1 percentage points smaller than the fall in world’s average RPK, with all airlines in the Top 15 posting contractions.
Ranking of the Top 15 airlines were dominated by airlines in China, US and Europe, continued to be distorted due to the divergent recovery pace by region and country.
Chinese airlines remained as the Top 3, with China Southern, China Eastern and Air China posting traffic decline ranging from -49% to -58% YoY. Hainan Airlines and Spring Airlines ranked down to 9th and 13th, respectively, as more major airlines in other regions started to recover. The latter, however, recorded the swiftest recovery with traffic bouncing back to 72.3% of the 2019 level.
American remained at 4th with a decline of -77.4% while Southwest went up to 5th recording the fastest recovery among the US airlines in the Top 15. Delta and United showed relatively slower recovery with traffic down by over -80% YoY, and ranked 7th and 10th, respectively.
Compared to the previous month, more noticeable improvements were recorded by airlines in Europe with an increasing number in the Top 15. Both Aeroflot and AF-KLM went up to 6th and 8th. Ryanair, Lufthansa, IAG and Turkish Airlines reappeared in the Top 15 list and ranked 11th, 12th, 14th and 15th.

Worldwide capacity contracted by -70.1% YoY in July 2020. Contraction in world capacity eased as more airlines resumed operations especially amongst countries where lockdowns and travel restrictions were loosened for leisure travel during the summer season. Europe led the race followed by North America, both of which recorded double-digit return.
Click here to download the Monthly Monitor September PDF version.
For any queries for further information, please contact the ICAO Economic Development (ECD), Air Transport Bureau ecd@icao.int
Acronyms: ACI: Airports Council International; ASK: Available Seat-Kilometres; IATA: International Air Transport Association; FTK: Freight Tonne-Kilometres; LF: Passenger Load Factor; OAG: Official Airline Guide; RPK: Revenue Passenger-Kilometres; UNWTO: World Tourism Organization; YoY: Year-on-year; YTD: Year-to-date.