The air transport industry is not only a vital engine of global socio-economic growth, but it is also of vital importance as a catalyst for economic development. Not only does the industry create direct and indirect employment and support tourism and local businesses, but it also stimulates foreign investment and international trade.
Informed decision-making is the foundation upon which successful businesses are built. In a fast-growing industry like aviation, planners and investors require the most comprehensive, up-to-date, and reliable data. ICAO’s aviation data/statistics programme provides accurate, reliable and consistent aviation data so that States, international organizations, aviation industry, tourism and other stakeholders can:
- make better projections;
- control costs and risks;
- improve business valuations; and
- benchmark performance.
The UN recognized ICAO as the central agency responsible for the collection, analysis, publication, standardization, improvement and dissemination of statistics pertaining to civil aviation. Because of its status as a UN specialized agency, ICAO remains independent from outside influences and is committed to consistently offering comprehensive and objective data. Every month ICAO produces this Air Transport Monitor, a monthly snapshot and analysis of the economic and aviation indicators.
ECONOMIC DEVELOPMENT – May 2021
World Results and Analyses for March 2021
Total Scheduled Services (Domestic and International)
Passenger traffic
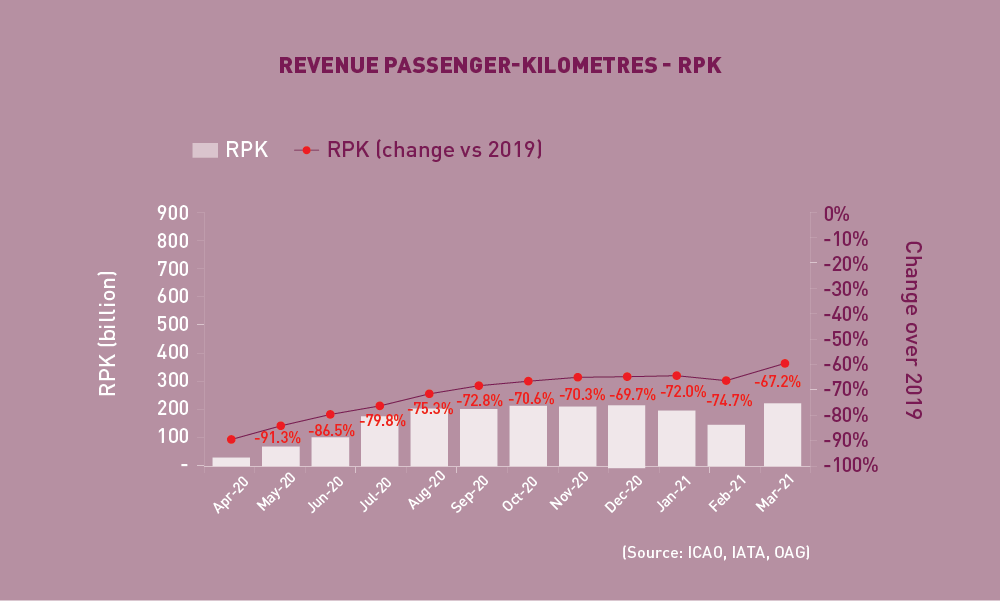 Revenue Passenger-Kilometres – RPK
World passenger traffic fell by -67.2% in March 2021 (compared to 2019), +7.5 percentage points up from the decline in the previous month. After two consecutive months of deterioration, passenger traffic picked up, driven by the rebound in domestic demand, particularly in China where lockdowns and travel restrictions have eased. The pace of recovery diverged across regions. Whereas Africa and Latin America/Caribbean slowed down, the other regions showed improvements, especially in Asia/Pacific and North America.
 International Traffic vs. Tourist Arrivals
International passenger numbers fell by -87.1% in March 2021 (compared to 2019), +1.2 percentage points up from the decline in the previous month. International travel measures remained strict across all regions amid the emergence of new variants. Asia/Pacific was the slowest recovering region at merely 5% of 2019 traffic levels. The international tourist arrivals also remained stagnant and followed a similar trend as international passenger traffic.
Capacity
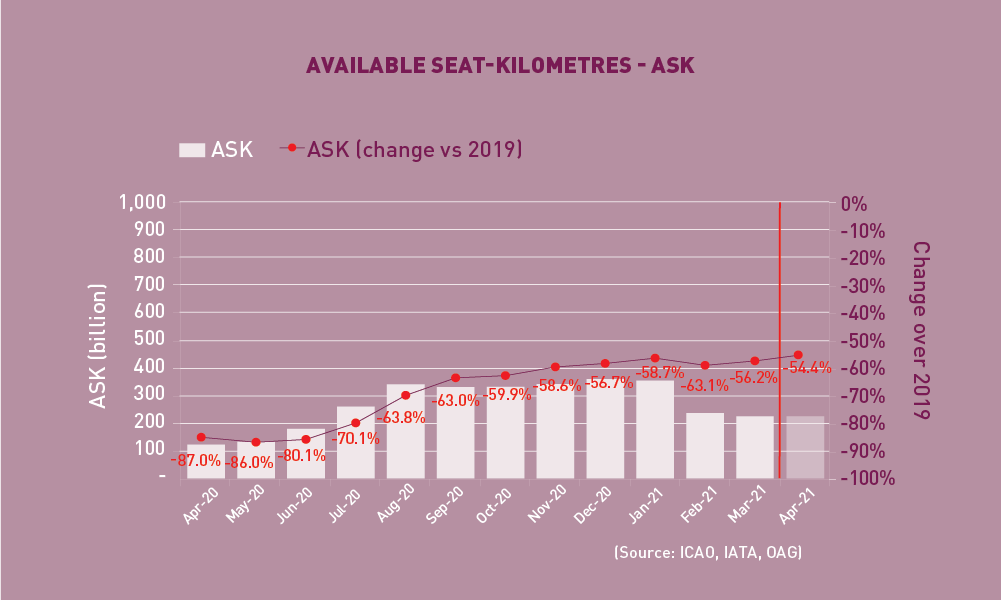 Available Seat-Kilometres – ASK
Capacity worldwide fell by -56.8% in March 2021 (compared to 2019), +6.3 percentage points up from the decline in the previous month (-63.1%). With progress in vaccine rollout, capacity is expected to increase in April 2021 to -54.4% down from the 2019 level.
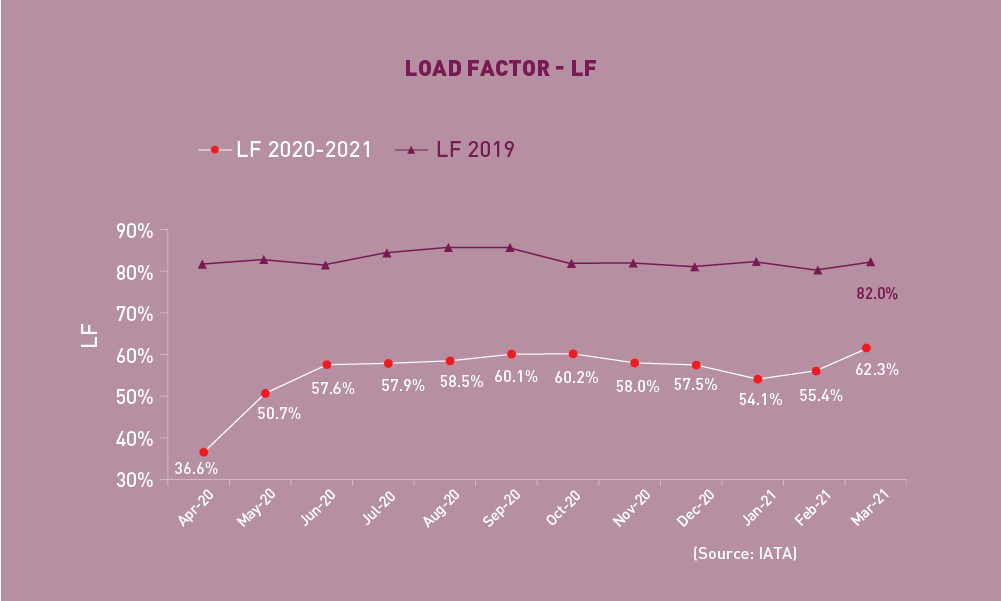
Load Factor
The passenger Load Factor reached 62.3% in March 2021, +6.9 percentage points higher than the previous month. Asia/Pacific and North America were the main contributors to the load factor improvements. As air travel demand fell faster than capacity, the March LF was -19.7 percentage points lower than the rate in the same period of 2019.
Freight Traffic
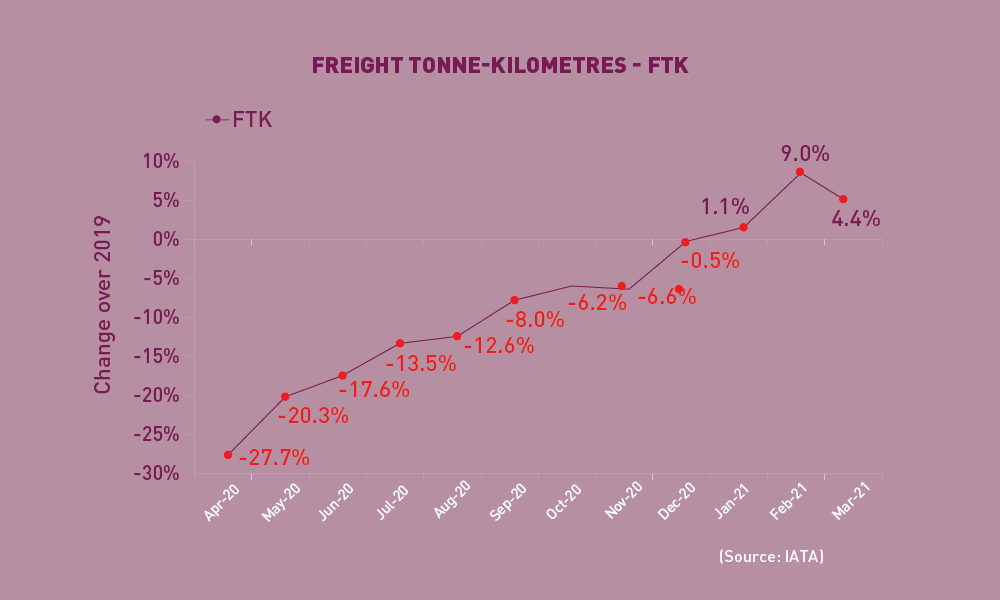
Freight Tonne-Kilometres – FTK
World freight traffic reported a growth of +4.4% in March 2021 (compared to 2019), -4.6 percentage points lower than the growth in the previous month. Albeit with a softened growth rate, air cargo demand remained strong, supported by the gradual rebound in global economic activity and increase in export. All regions, except for the Middle East and North America, showed a moderation in freight traffic expansion, with noticeable slowdown in Africa and Asia/Pacific. Nevertheless, Africa still grew rose double-digitally and topped the growth chart, followed by North America. Asia/Pacific and Latin America/Caribbean were the only regions posting contractions from 2019 levels, with the latter recording the weakest performance.
Top 15 Airports (Ranked by aircraft departures, passengers, and volume of freight)
Note: Figures include total scheduled and non-scheduled services
March 2021: -19.6%, -31.0%, and +14.1% (vs. 2019) in terms of aircraft departures, passengers and freight for the Top 15
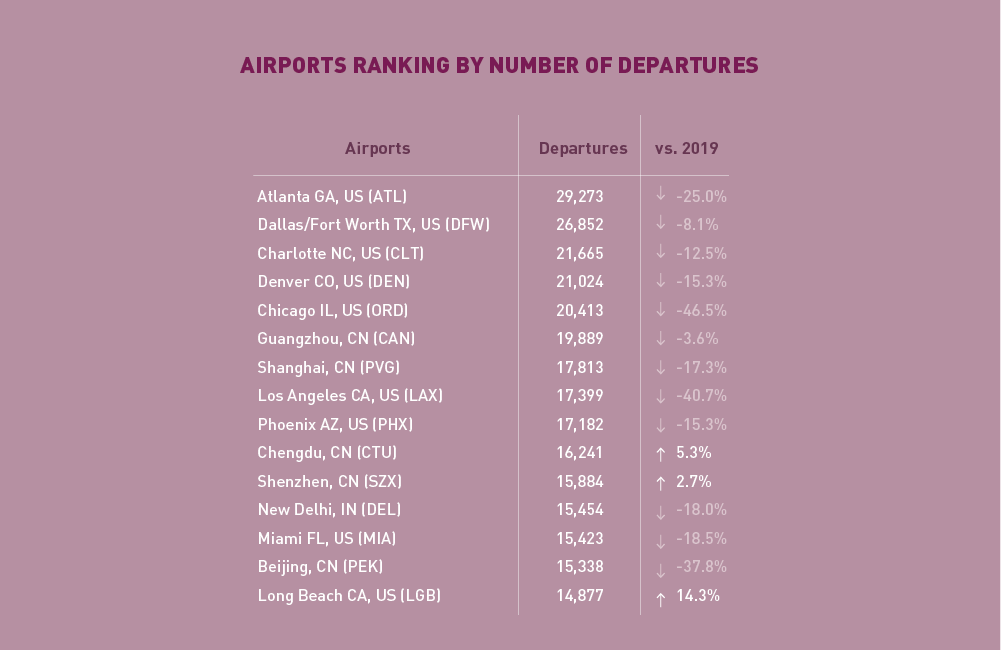
In terms of aircraft departures, the Top 15 airports reported a combined fall of -19.6%, compared to 2019. A few airports posted positive growth, particularly Long Beach which increased double-digitally. Two Chinese airports, Chengdu and Shenzhen also rose +5.3% and +2.7%, respectively. Atlanta retained the 1st position with a decline of -25.0%.

In terms of passengers, the Top 15 airports posted a total fall of -31.0%, compared to 2019. Passenger traffic remained below 2019 levels for all Top 15 airports. Nevertheless, some Chinese airports showed faster recovery with Chengdu posting the smallest contraction at -0.2%. Guangzhou regained the 1st position with -18.0% decline, followed by Atlanta, albeit with a larger fall at -52.0%.
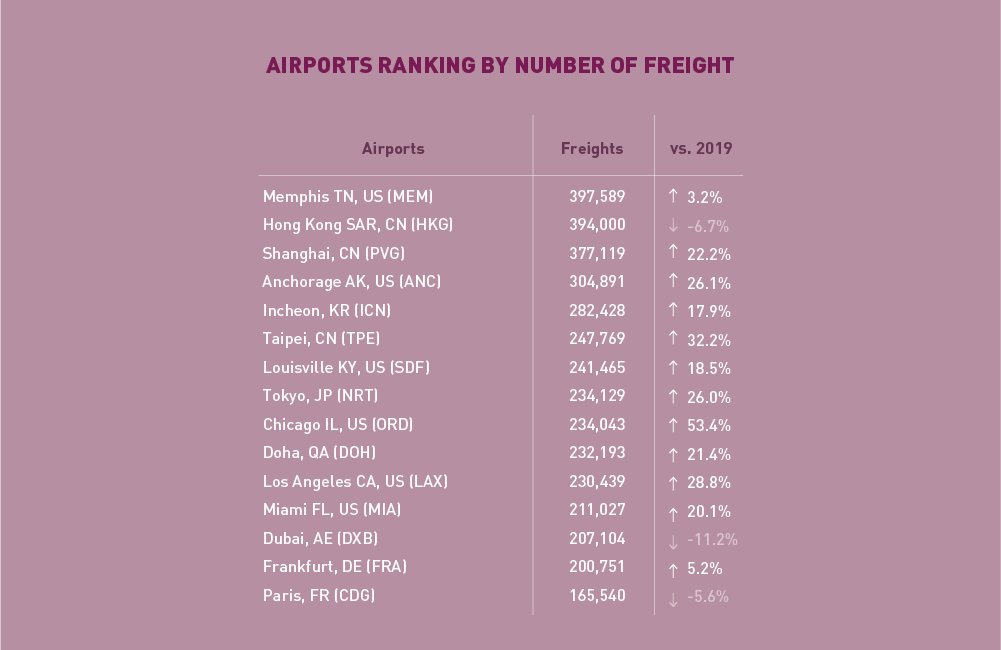
In terms of freight, the Top 15 airports reported an increase of +14.1%, compared to 2019. All Top 15 ticked up, except for Hong Kong (-6.7%), Dubai (-11.2%) and Paris (-5.6%). With a modest growth of +3.2%, Memphis overtook Hong Kong and became 1st. Chicago continued to record the largest increase at +53.4%.
Top 15 Airline Groups (Ranked by RPK)
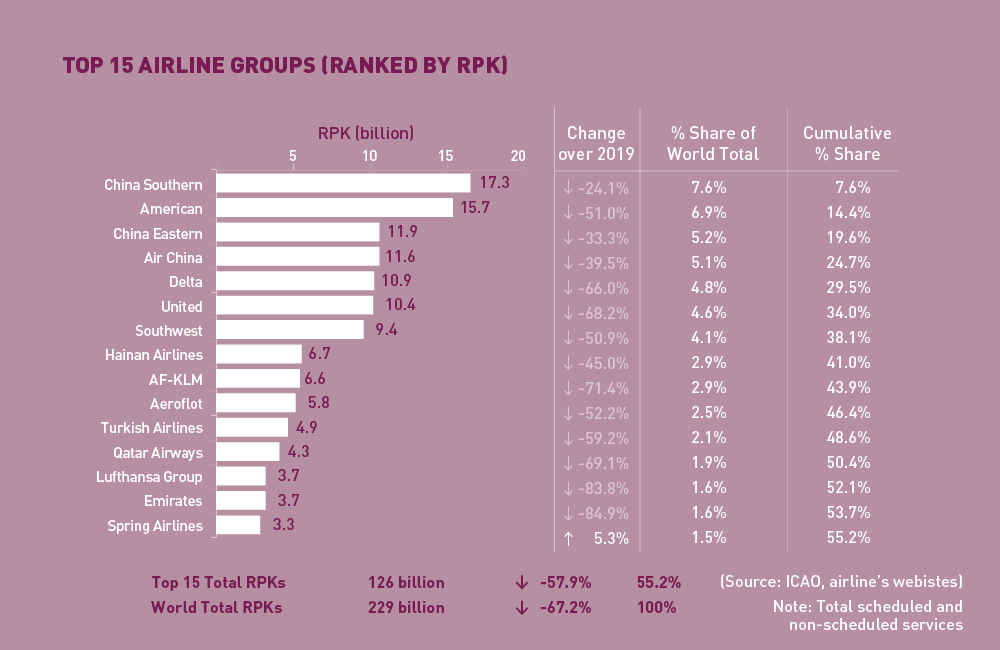 March 2021: 57.9% (vs. 2019) in terms of RPK for the Top 15
In terms of RPK, the Top 15 airline groups accounted for 55.2% of the world’s total RPK in March 2021 and declined by –57.9% compared to 2019. This decline was 9.3 percentage points smaller than the fall in world’s average RPK.
For the first time since April 2020, a positive growth from the pre-COVID-19 levels emerged among Top 15 airlines. Airlines in countries with large domestic markets continued to lead the growth chart.
Following two consecutive months of deterioration, the Chinese airlines rebounded sharply. China Southern surpassed American and ranked 1st. China Eastern, Air China and Hainan Airlines improved to 3rd, 4th, and 8th, respectively. All Chinese airlines recorded faster recovery compared to other airlines in the Top 15, with Spring Airlines being the only airline exceeding 2019 levels.
All US airlines posted improvements supported by rapid vaccination progress. American ranked 2nd, outpacing other US airlines in the Top 15. Delta and United moved down to 5th and 6th, while Southwest maintained the 7th position.
Airlines in Europe continued to show slower recovery. Lufthansa and KLM posted the second and third largest contraction and remained at over 70% and 80% below 2019 levels, respectively. Aeroflot and Turkish Airlines showed slightly better performance at 50-60% down from 2019. Two airlines in the Middle East, Qatar and Emirates ranked 12th and 14th, respectively, while the latter posted the largest decline from 2019.
 Worldwide capacity contracted by -56.8% in March 2021, compared to 2019. All regions, except for Africa and Latin America/Caribbean, saw smaller declines in capacity compared to the previous month. The most noticeable increase was recorded in Asia/Pacific, owing to the rebound of China domestic demand. Capacity offered in Europe continued to be far below 2019 levels.
Click here to download the Monthly Monitor April PDF version.
For any queries for further information, please contact the ICAO Economic Development (ECD), Air Transport Bureau ecd@icao.int
Acronyms: ACI: Airports Council International; ASK: Available Seat-Kilometres; IATA: International Air Transport Association; FTK: Freight Tonne-Kilometres; LF: Passenger Load Factor; OAG: Official Airline Guide; RPK: Revenue Passenger-Kilometres; UNWTO: World Tourism Organization; YoY: Year-on-year; YTD: Year-to-date.