The air transport industry is not only a vital engine of global socio-economic growth, but it is also of vital importance as a catalyst for economic development. Not only does the industry create direct and indirect employment and support tourism and local businesses, but it also stimulates foreign investment and international trade.
Informed decision-making is the foundation upon which successful businesses are built. In a fast-growing industry like aviation, planners and investors require the most comprehensive, up-to-date, and reliable data. ICAO’s aviation data/statistics programme provides accurate, reliable and consistent aviation data so that States, international organizations, aviation industry, tourism and other stakeholders can:
- make better projections;
- control costs and risks;
- improve business valuations; and
- benchmark performance.
The UN recognized ICAO as the central agency responsible for the collection, analysis, publication, standardization, improvement and dissemination of statistics pertaining to civil aviation. Because of its status as a UN specialized agency, ICAO remains independent from outside influences and is committed to consistently offering comprehensive and objective data. Every month ICAO produces this Air Transport Monitor, a monthly snapshot and analysis of the economic and aviation indicators.
ECONOMIC DEVELOPMENT – March 2020
World Results and Analyses for January 2020
Total Scheduled Services (Domestic and International)
![]()
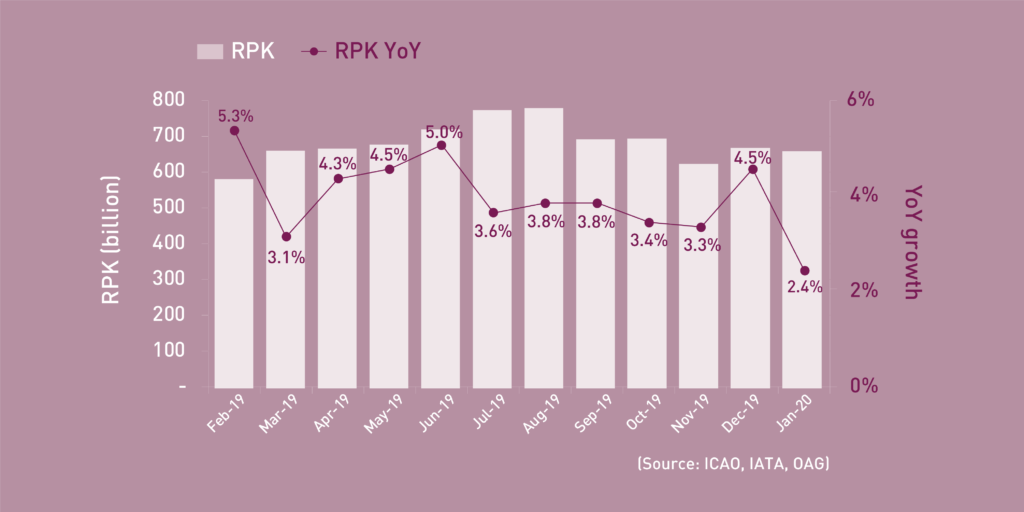
Revenue Passenger-Kilometres – RPK
World passenger traffic grew by +2.4% YoY in January 2020, -2.1 percentage points lower than the growth in the previous month. All regions experienced a slowdown, except for the Middle East at the same pace. The most notable decline was observed in Asia/Pacific impacted by the COVID-19 outbreak started from the last week of the month. The disruption primarily affected domestic traffic of China and international demand within the region. Chinese domestic traffic fell by around -7.0% for the first time since 2008, contributing to the overall domestic traffic softening.
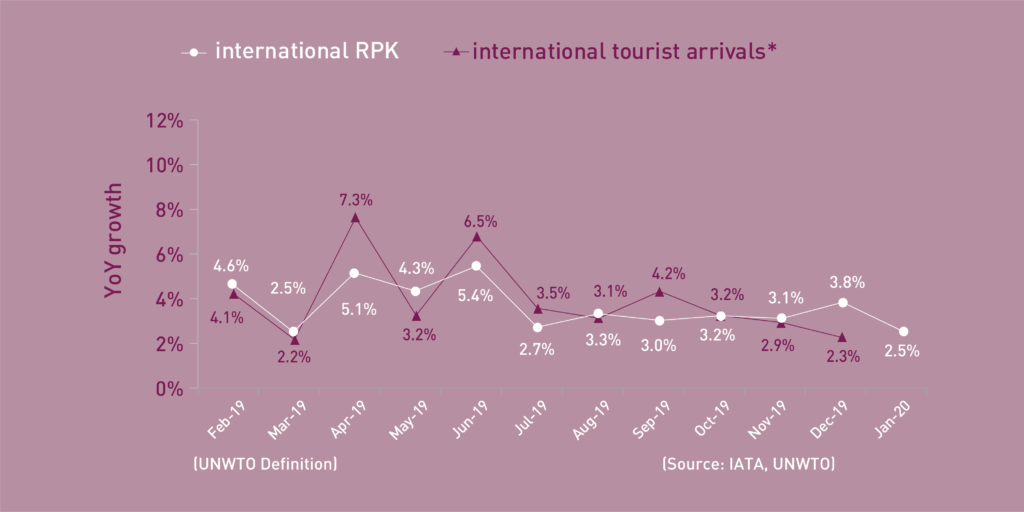
International Traffic vs. Tourist Arrivals
International passenger traffic grew by +2.5% YoY in January 2020, -1.3 percentage points lower than the growth in the previous month. All regions recorded slowdown except for a meagre up in Africa. Flight cancellations due to COVID-19 were initially limited to Asia/Pacific, but the scale of impact is expected to be wider and intensified in the following month. The growth of international tourist arrivals* remained relatively stable.
![]()
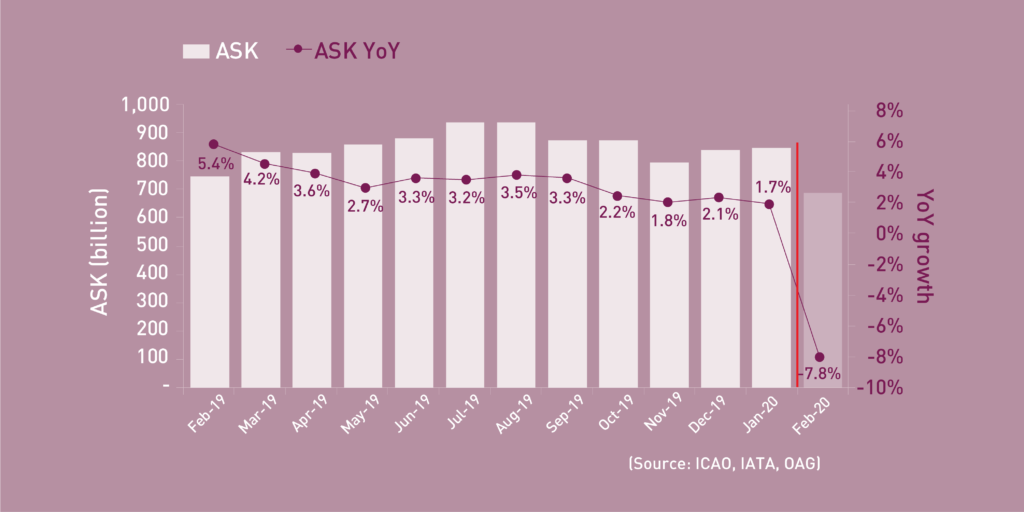
Available Seat-Kilometres – ASK
Capacity worldwide increased by +1.7% YoY in January 2020, -0.4 percentage point lower than the growth in the previous month (+2.1%). The containment measures will lead to further flight cancellations and travel restrictions. As a result, capacity is expected to slump to -7.8% YoY in February 2020.
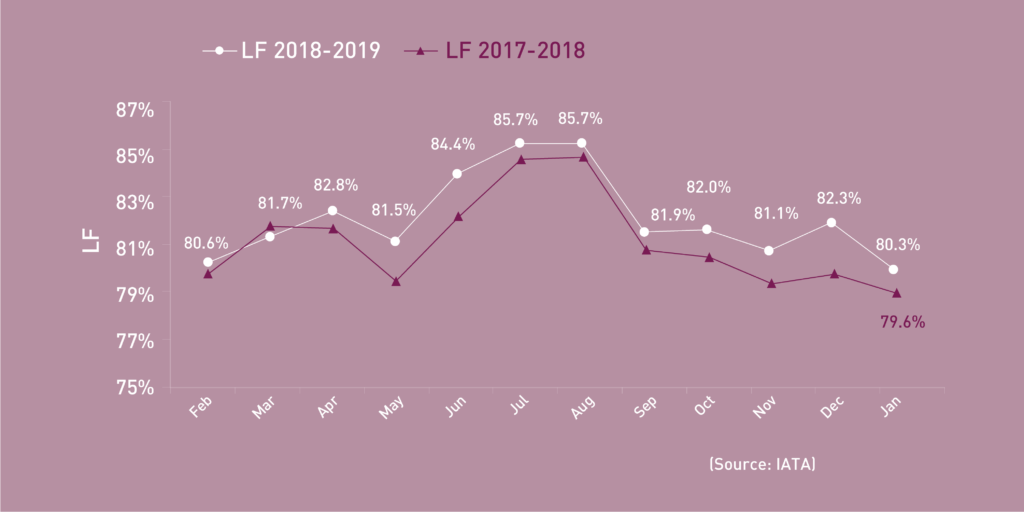
Load Factor – LF
The passenger Load Factor reached 80.3% in January 2020, -2.0 percentage points lower than the previous month. As traffic growth outpaced the capacity expansion, the January LF was +0.7 percentage points higher compared to the rate in the same period of 2019.
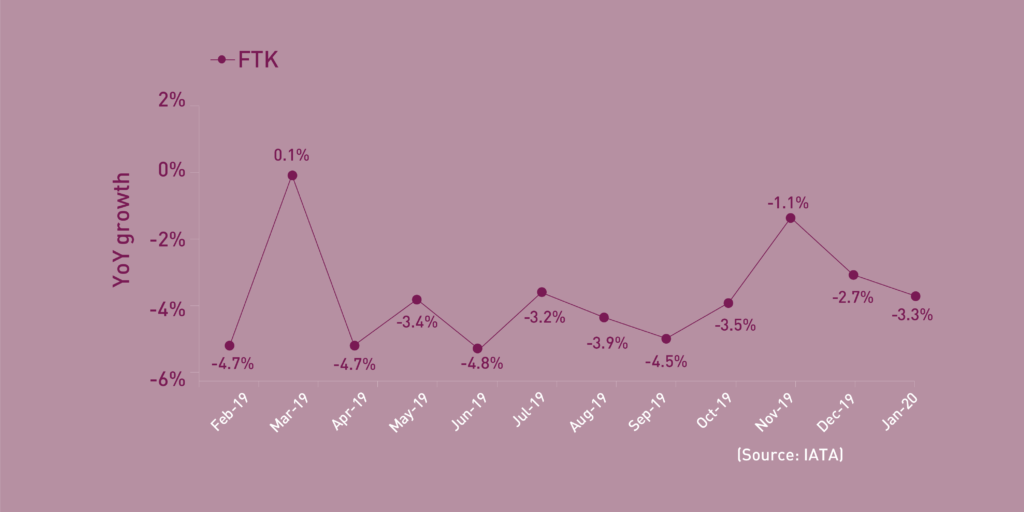
Freight Tonne-Kilometres – FTK
World freight traffic reported a decline of -3.3% YoY in January 2020, a further slip of -0.6 percentage point from the decline of the previous month. Later timing of Chinese New Year and the conclusion of a phase one trade agreement between the United States and China positively contributed to the air cargo demand. However, this was then offset by the disruption on the cargo supply chain due to COVID-19 outbreak at the end of the month. All regions posted negative growth, except for Africa and Latin America/Caribbean. Asia/Pacific became the weakest performing region, accounting for the bulk of the overall freight traffic decline, followed by the stagnant performance in Europe.

January 2020: +1.9%, -1.8%, and -6.4% YoY in terms of aircraft departures, passengers and freight for the Top 15
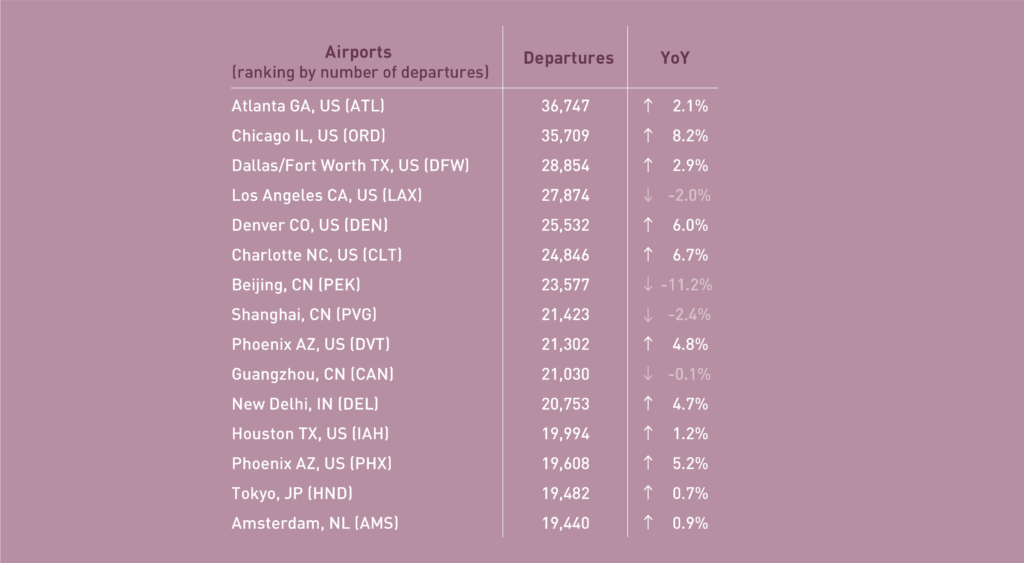
In terms of aircraft departures, the Top 15 airports reported a growth of +1.9% YoY. Eleven out of the Top 15 airports posted YoY increases. Atlanta ranked 1st up by +2.1%, whereas, Chicago became 2nd albeit recording the highest growth at +8.2%. Beijing experienced the most significant decline at -11.2% due to flight cancellations.
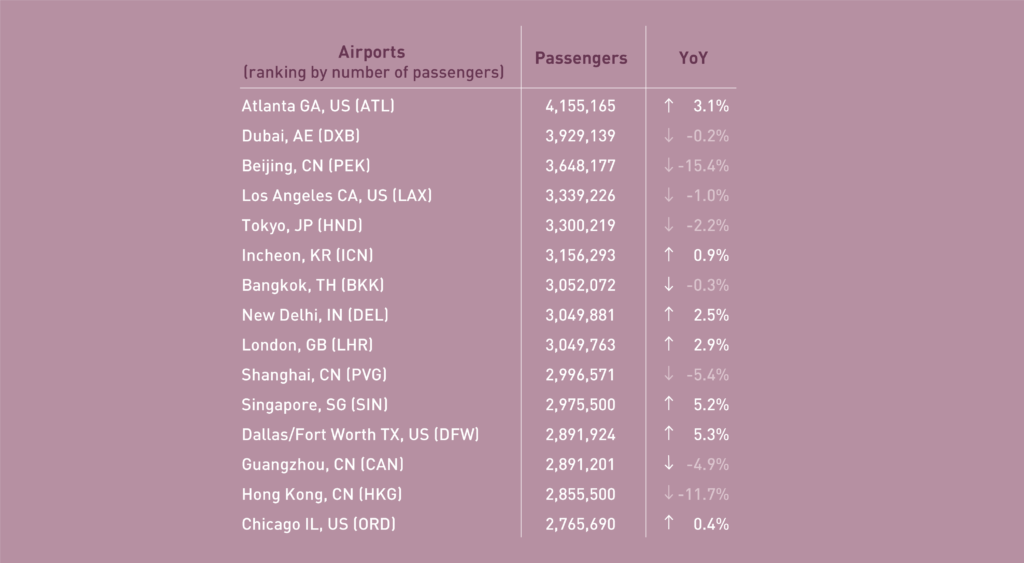
In terms of passengers, the Top 15 airports reported a decline of -1.8% YoY. Over half of the Top 15 airports posted YoY decrease. An abrupt decline was observed in major hubs in Asia/Pacific, mostly in China, heavily impacted by the travel bans and falling demand. Beijing, Hong Kong and Shanghai, contracted by -15.4%, -11.7% and -5.4%, respectively.
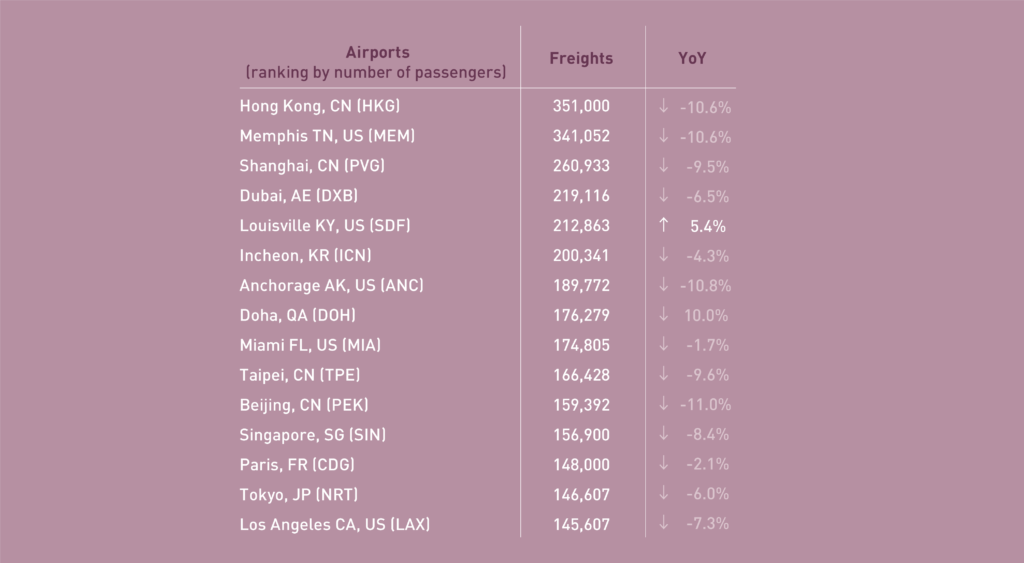
In terms of freight, the Top 15 airports reported a decline of -6.4% YoY. Most of the Top 15 airports posted declines with double-digit fall in 4 major hubs. Beijing slumped by -11.0%, followed by Anchorage at -10.8% and Hong Kong at -10.6%. Two airports contributed positively to freight traffic with Doha recording the highest growth at +10.0% followed by Louisville at +5.4%.
January 2020: +2.6% YoY in terms of RPK for the Top 15
In terms of RPK, the Top 15 airline groups accounted for 46.8% of the world’s total RPK in January 2020 and grew by +2.6% YoY. This growth was +0.2 percentage point higher than the world’s average on scheduled services. Eleven out of the Top 15 airline groups posted YoY growth.
American ranked 1st albeit with moderate growth of +2.0%. United rose by +3.8% and went down 1 position to the 2nd. Delta remained at 3rd and grew by +6.0%. Southwest posted the largest decline among the Top 15 at -4.5% and ranked 1 position down to 12th.
Emirates grew by +2.8% while remained at 4th. Qatar Airways recorded the fastest growth among the Top 15 airlines at +14.1% and improved 1 position to 11th.
AF-KLM and Lufthansa ranked 1 position up to 5th and 7th, albeit with modest growth at +2.7% and +3.0%, respectively. IAG increased by +2.0% and ranked 1 position down to 8th. Ryanair and Turkish Airlines maintained their position at 13th and 15th, and increased by +2.8% and +8.6%, respectively.
All of the three major Chinese airlines posted declines due to the flight cancellations and demand drop. With a decrease of -2.4%, China Southern went down 1 position to 6th. Air China and China Eastern retained their 9th and 10th position, however, contracted by -2.9% and -1.3%, respectively. Singapore Airlines grew by 7.9% and remained at 14th.
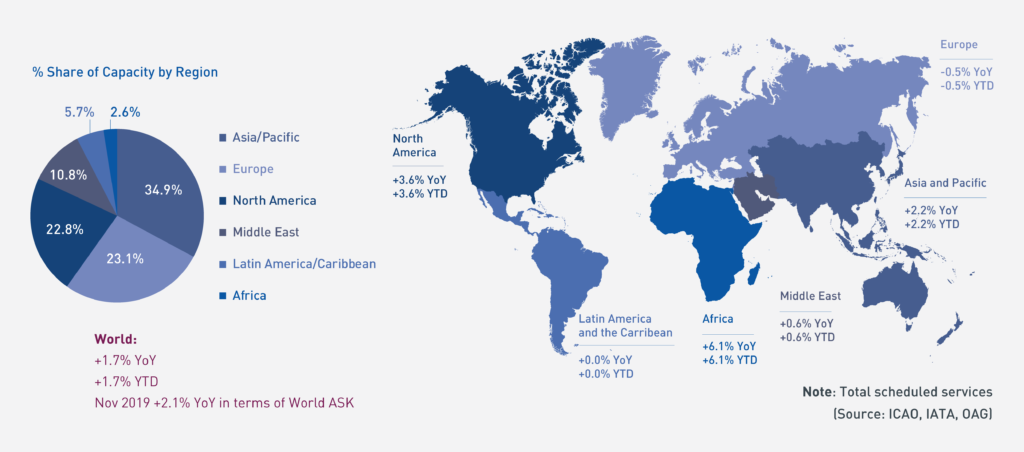
Worldwide capacity expansion grew by +1.7% YoY in January 2020. Four regions, Asia/Pacific, Europe, Latin America/Caribbean and North America, decelerated in capacity expansion, with Europe being the only region recording negative growth at -0.5%. Africa continued to be the fastest capacity expanding region, followed by North America.
Acronyms: ACI: Airports Council International; ASK: Available Seat-Kilometres; IATA: International Air Transport Association; FTK: Freight Tonne-Kilometres; LF: Passenger Load Factor;
OAG: Official Airline Guide; RPK: Revenue Passenger-Kilometres; UNWTO: World Tourism Organization; YoY: Year-on-year; YTD: Year-to-date.