The air transport industry is not only a vital engine of global socio-economic growth, but it is also of vital importance as a catalyst for economic development. Not only does the industry create direct and indirect employment and support tourism and local businesses, but it also stimulates foreign investment and international trade.
Informed decision-making is the foundation upon which successful businesses are built. In a fast-growing industry like aviation, planners and investors require the most comprehensive, up-to-date, and reliable data. ICAO’s aviation data/statistics programme provides accurate, reliable and consistent aviation data so that States, international organizations, aviation industry, tourism and other stakeholders can:
- make better projections;
- control costs and risks;
- improve business valuations; and
- benchmark performance.
The UN recognized ICAO as the central agency responsible for the collection, analysis, publication, standardization, improvement and dissemination of statistics pertaining to civil aviation. Because of its status as a UN specialized agency, ICAO remains independent from outside influences and is committed to consistently offering comprehensive and objective data. Every month ICAO produces this Air Transport Monitor, a monthly snapshot and analysis of the economic and aviation indicators.
ECONOMIC DEVELOPMENT – June 2021
World Results and Analyses for April 2021
Total Scheduled Services (Domestic and International)
Passenger traffic
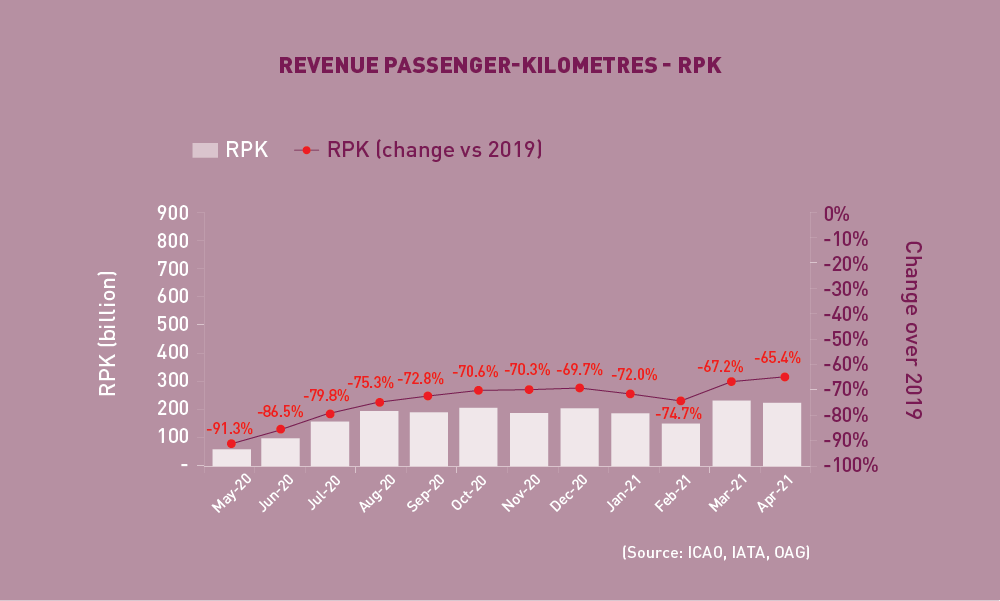 Revenue Passenger-Kilometres – RPK
World passenger traffic fell by -65.4% in April 2021 (compared to 2019), +1.8 percentage points up from the decline in the previous month. Recovery in air travel continued alongside the decline in new COVID-19 cases at the global level. Nevertheless, wide disparities exist between regions as a result of the varying pandemic situation and travel restrictions, particularly the emergence of new variants in certain parts of the world. Domestic travel remained the driving force for recovery with both domestic traffic of China and the Russian Federation surpassing the 2019 levels.
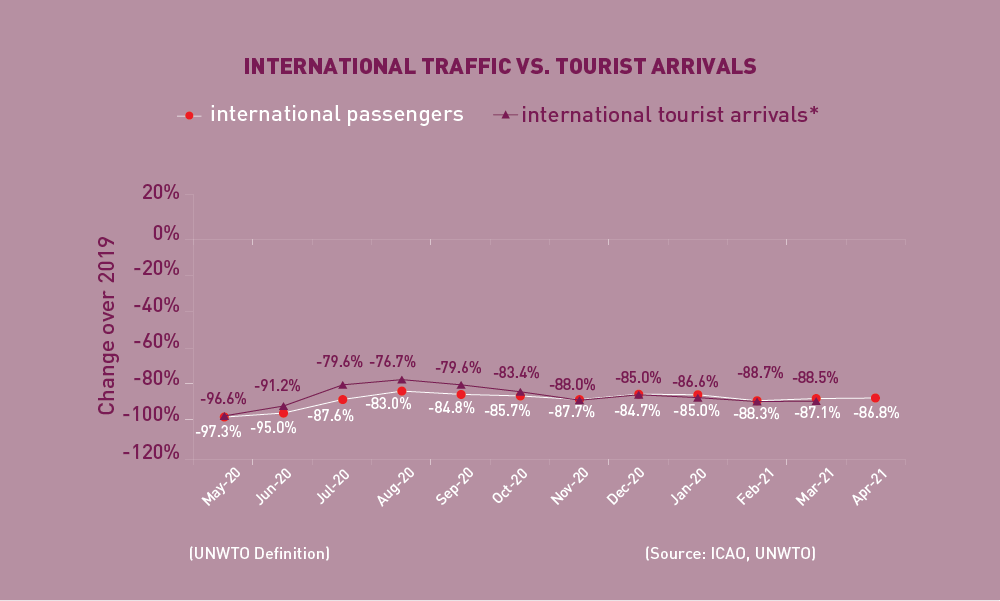 International Traffic vs. Tourist Arrivals
International passenger numbers fell by -86.8% in April 2021 (compared to 2019), +0.3 percentage point up from the decline in the previous month. International travel remained unchanged with strict border restrictions due to the concern of surging new variants. Asia/Pacific and Europe were the slowest recovering regions. The international tourist arrivals also remained stagnant and followed a similar trend as international passenger traffic.
Capacity
 Available Seat-Kilometres – ASK
Capacity worldwide fell by -54.5% in April 2021 (compared to 2019), +2.3 percentage points up from the decline in the previous month (-56.8%). With the ongoing improvements, capacity is expected to increase in May 2021 to -52.1% down from the 2019 level.
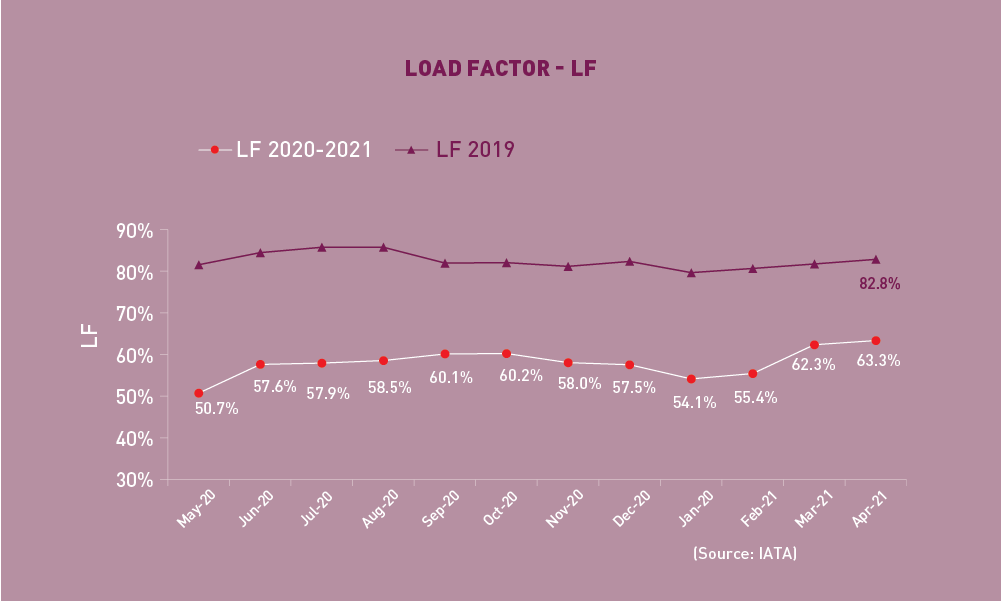
Load Factor
The passenger Load Factor reached 63.3% in April 2021, +1.0 percentage point higher than the previous month. The domestic load factor picked up notably and reached above 70%. As air travel demand fell faster than capacity, the April LF was -19.5 percentage points lower than the rate in the same period of 2019.
Freight Traffic
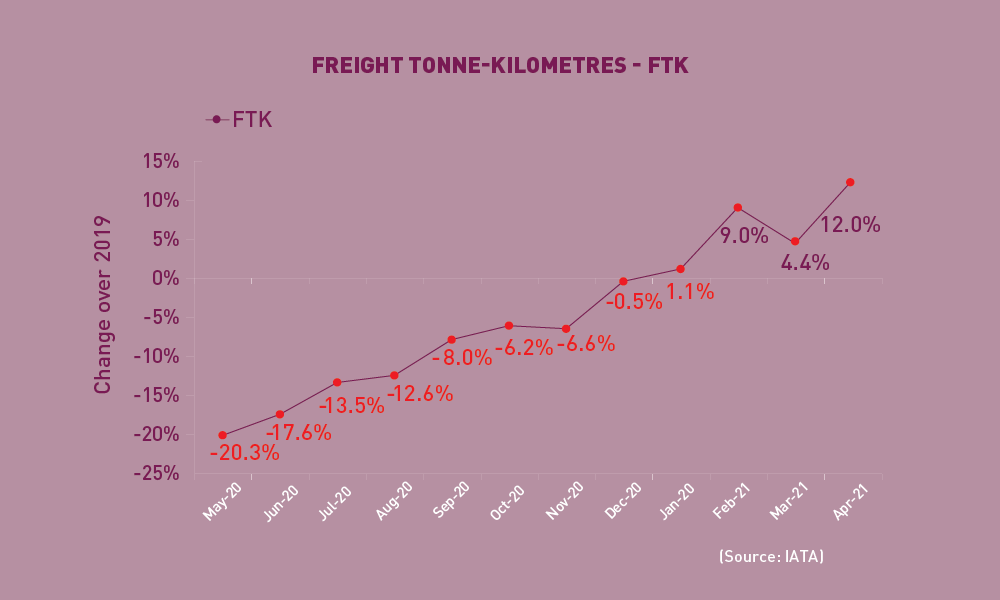 Freight Tonne-Kilometres – FTK
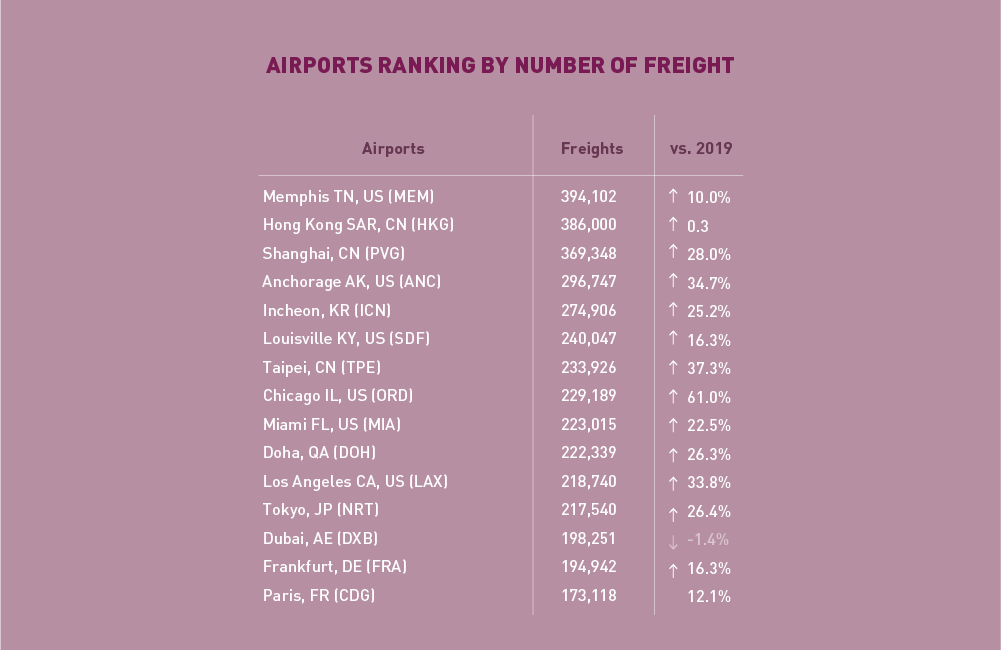
World freight traffic reported a growth of +12.0% in April 2021 (compared to 2019), +7.6 percentage points higher than the growth in the previous month. After one month of moderation, freight traffic rose sharply with double-digit growth. Several factors have been contributing to the strong air cargo demand such as the strengthening in global economic activity, trade, and rise in consumer spending including e-commerce. All regions showed improvements in freight traffic, except for Latin America/Caribbean which was the only region that remained below 2019 levels and further deteriorated in April. Africa and North America continued to lead the growth chart, expanding at over +30% and +20%, respectively.
Top 15 Airports (Ranked by aircraft departures, passengers, and volume of freight)
Note: Figures include total scheduled and non-scheduled services
April 2021: –15.2%, -27.7%, and +20.7% (vs. 2019) in terms of aircraft departures, passengers and freight for the Top 15
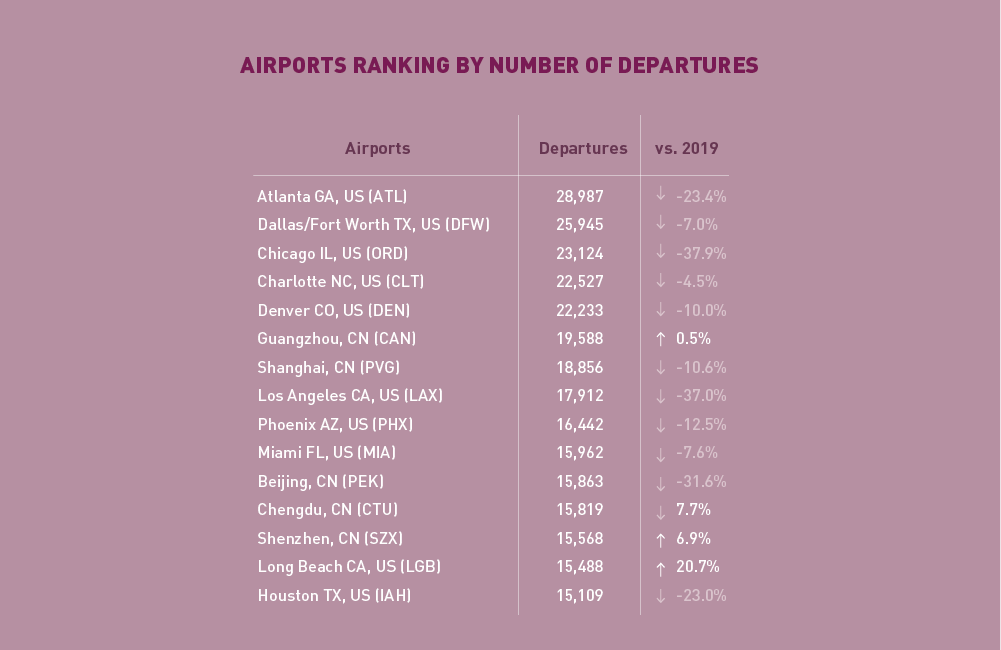 In terms of aircraft departures, the Top 15 airports reported a combined fall of -15.2%, compared to 2019. The Top 15 list consists of ten US and five Chinese airports. Atlanta remained 1st with a decline of -23.4%. Long Beach continued to increase double-digitally, followed by Chengdu (+7.7%) and Shenzhen (+6.9%), respectively.
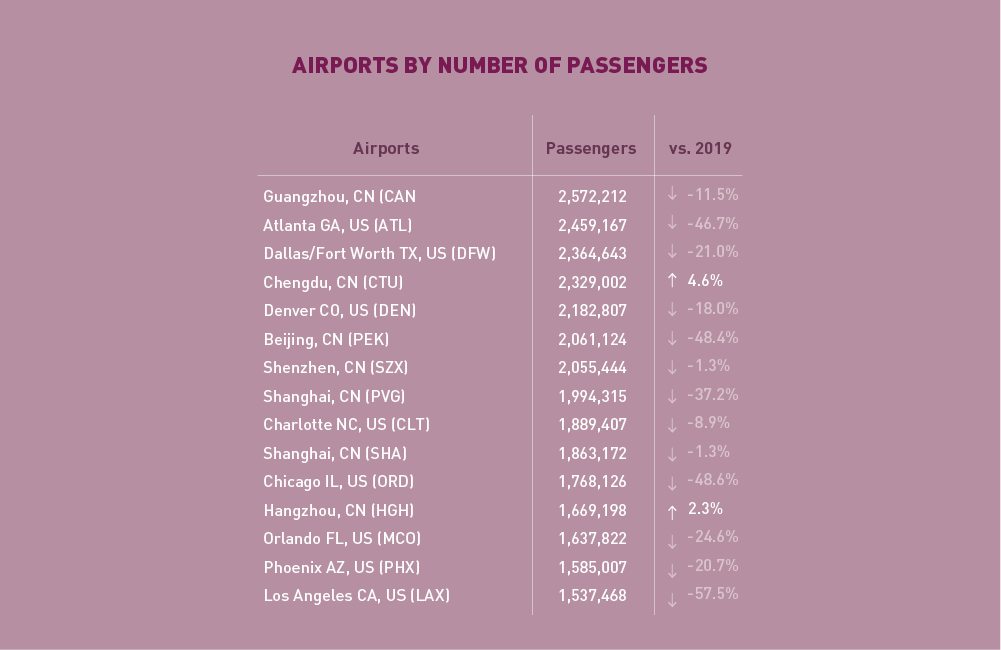
In terms of passengers, the Top 15 airports posted a total fall of -27.7%, compared to 2019. Same as departures, only US (8) and Chinese (7) airports ranked within the Top 15. Guangzhou retained the 1st position with a -11.5% decline. Overall, Chinese airports showed smaller contractions with Chengdu and Hangzhou posting positive growth at +4.6% and +2.3%, respectively.
In terms of passengers, the Top 15 airports posted a total fall of -27.7%, compared to 2019. Same as departures, only US (8) and Chinese (7) airports ranked within the Top 15. Guangzhou retained the 1st position with a -11.5% decline. Overall, Chinese airports showed smaller contractions with Chengdu and Hangzhou posting positive growth at +4.6% and +2.3%, respectively.
Top 15 Airline Groups (Ranked by RPK)
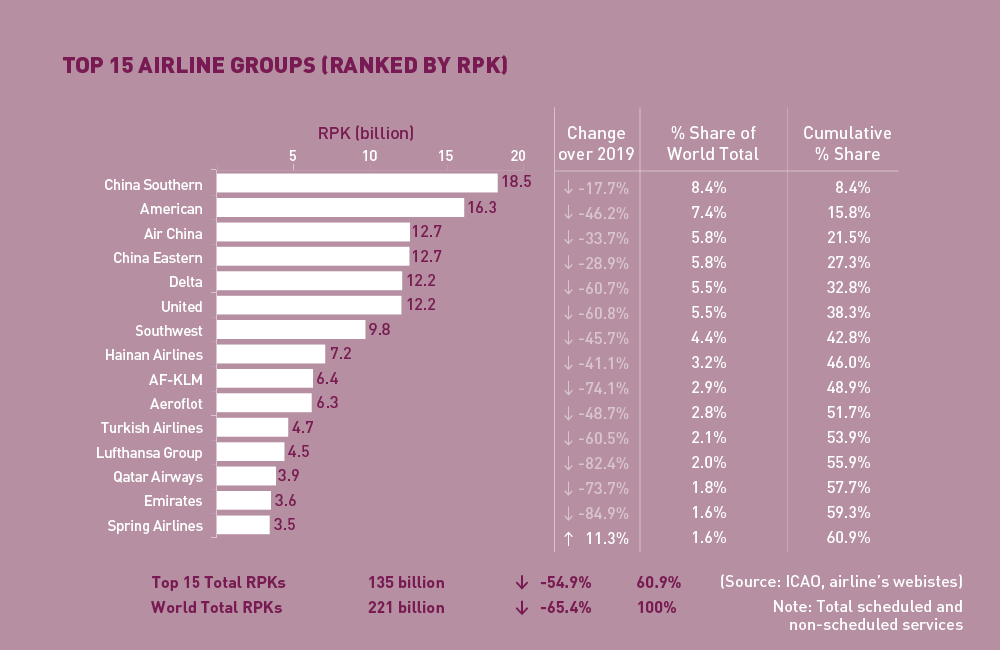
April 2021: –54.9% (vs. 2019) in terms of RPK for the Top 15
In terms of RPK, the Top 15 airline groups accounted for 60.9% of the world’s total RPK in April 2021 and declined by –54.9% compared to 2019. This decline was 10.5 percentage points smaller than the fall in the world’s average RPK. While global passenger traffic improved, the recovery pace remained uneven among regions. Airlines in countries with large domestic markets continued to lead the growth chart.
All Chinese airlines recorded faster recovery compared to other airlines in the Top 15. China Southern maintained the 1st position with RPKs at -17.7% below 2019 levels. Air China overtook China Eastern became 3rd, and Hainan Airlines kept the same position. Spring Airlines continued to be the only airline posting positive growth and expanded strongly at +11.3%.
US airlines demonstrated solid improvements. American and Southwest showed relatively faster recovery than other US airlines in the Top 15. American ranked 2nd and recovered to over half of the 2019 RPK levels. Delta, United, and Southwest stayed at the same positions as in March.
Recovery of airlines in Europe has been weak. Lufthansa and KLM continued to post the second and third largest contraction from 2019 levels. Aeroflot and Turkish Airlines showed slightly better performance at -48.7% and -60.5%, respectively.
Airlines in the Middle East also experienced slow recovery with Emirates posting the largest contraction from 2019 levels, at -84.9%.
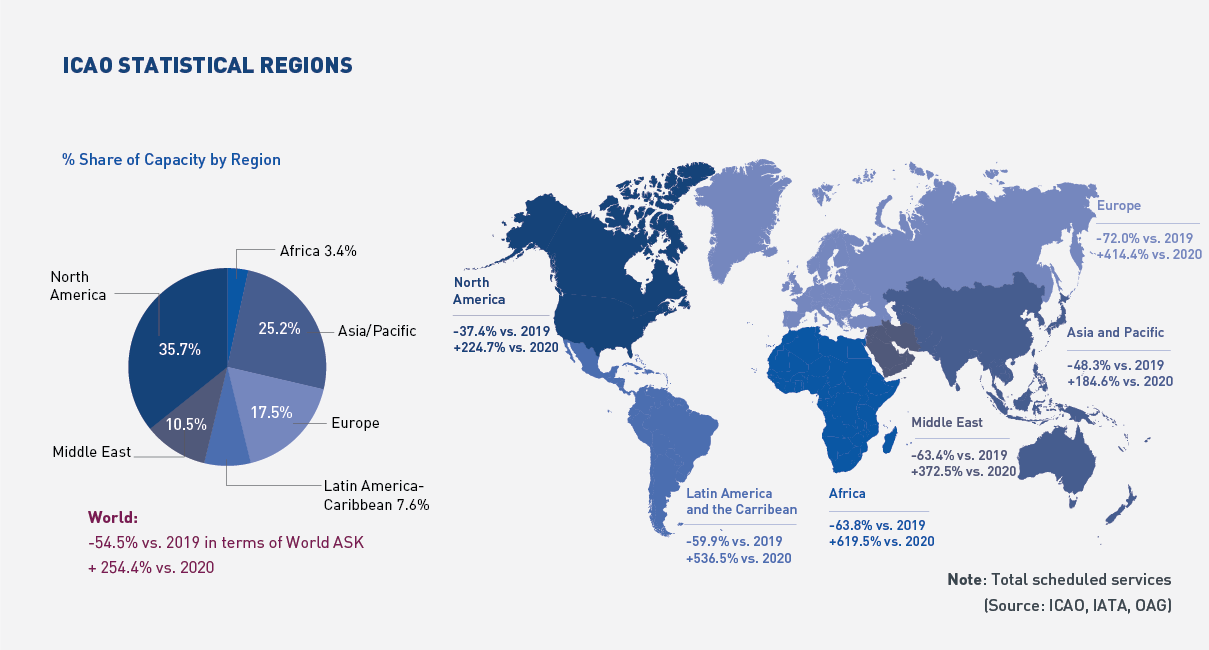
Worldwide capacity contracted by -54.5% in April 2021, compared to 2019. All regions saw slight improvements in capacity compared to the previous month, except for Africa and Latin America/Caribbean which experienced larger declines. Capacity offered in North America and Asia/Pacific showed the smallest decline from 2019 levels, while Europe continued to record the slowest capacity recovery.
Click here to download the Monthly Monitor June PDF version.
For any queries for further information, please contact the ICAO Economic Development (ECD), Air Transport Bureau ecd@icao.int
Acronyms: ACI: Airports Council International; ASK: Available Seat-Kilometres; IATA: International Air Transport Association; FTK: Freight Tonne-Kilometres; LF: Passenger Load Factor; OAG: Official Airline Guide; RPK: Revenue Passenger-Kilometres; UNWTO: World Tourism Organization; YoY: Year-on-year; YTD: Year-to-date.