The air transport industry is not only a vital engine of global socio-economic growth, but it is also of vital importance as a catalyst for economic development. Not only does the industry create direct and indirect employment and support tourism and local businesses, but it also stimulates foreign investment and international trade.
Informed decision-making is the foundation upon which successful businesses are built. In a fast-growing industry like aviation, planners and investors require the most comprehensive, up-to-date, and reliable data. ICAO’s aviation data/statistics programme provides accurate, reliable and consistent aviation data so that States, international organizations, the aviation industry, tourism and other stakeholders can:
- make better projections;
- control costs and risks;
- improve business valuations; and
- benchmark performance.
The UN recognized ICAO as the central agency responsible for the collection, analysis, publication, standardization, improvement, and dissemination of statistics pertaining to civil aviation. Because of its status as a UN specialized agency, ICAO remains independent from outside influences and is committed to consistently offering comprehensive and objective data. Every month ICAO produces this Air Transport Monitor, a monthly snapshot and analysis of the economic and aviation indicators.
ECONOMIC DEVELOPMENT – July 2022
World Results and Analyses for May 2022
Total Scheduled Services (Domestic and International)
Passenger traffic
![]() Revenue Passenger-Kilometres – RPK
Revenue Passenger-Kilometres – RPK
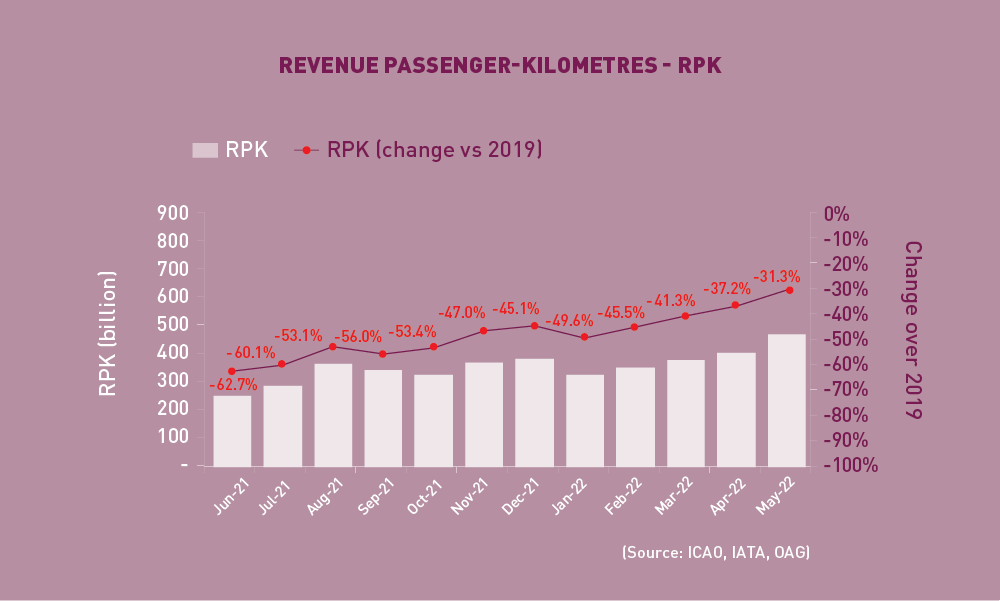
World passenger traffic in May 2022 was -31.3% below the 2019 level, +5.9 percentage points up from the decline in the previous month. Air travel recovery continued to accelerate, driven by the strong international travel rebound. The pent-up travel demand has been defying the challenging economic backdrop of high inflation and fuel prices. Domestic traffic recovery was moderate, affected by the decline in the Chinese domestic market. All regions, except for North America, recorded traffic improvements compared to the previous month.
![]() International Traffic vs. Tourist Arrivals
International Traffic vs. Tourist Arrivals
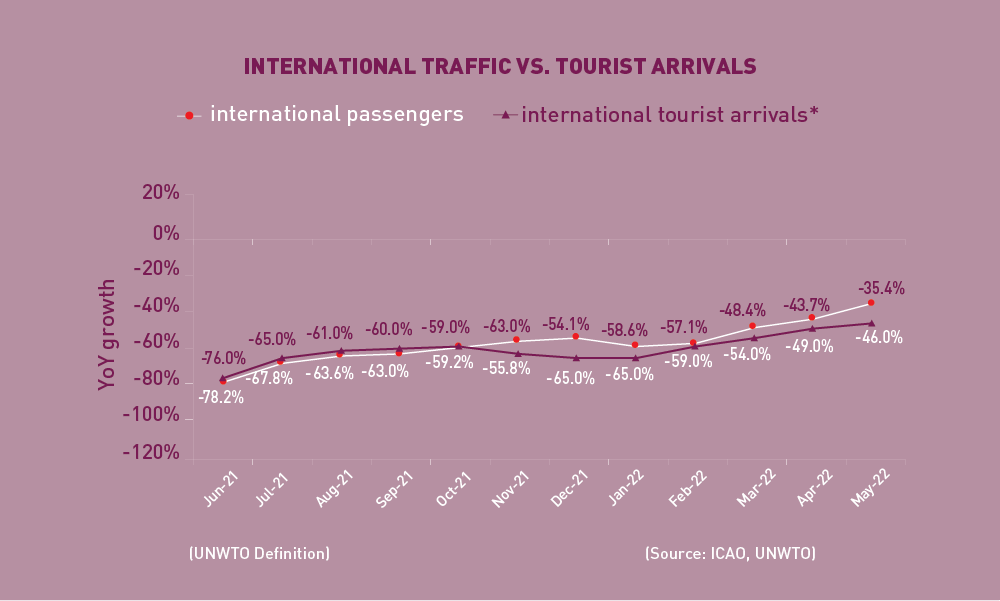
International passenger numbers in May 2022 were -35.4% below the 2019 level, +8.3 percentage points up from the decline in the previous month. International air travel recovery improved across all regions, except for Latina America/Caribbean. The Middle East registered the most significant month-on-month improvement. The recovery in international tourist arrivals followed a similar trend as international passenger traffic.
Capacity
![]() Available Seat-Kilometres – ASK
Available Seat-Kilometres – ASK
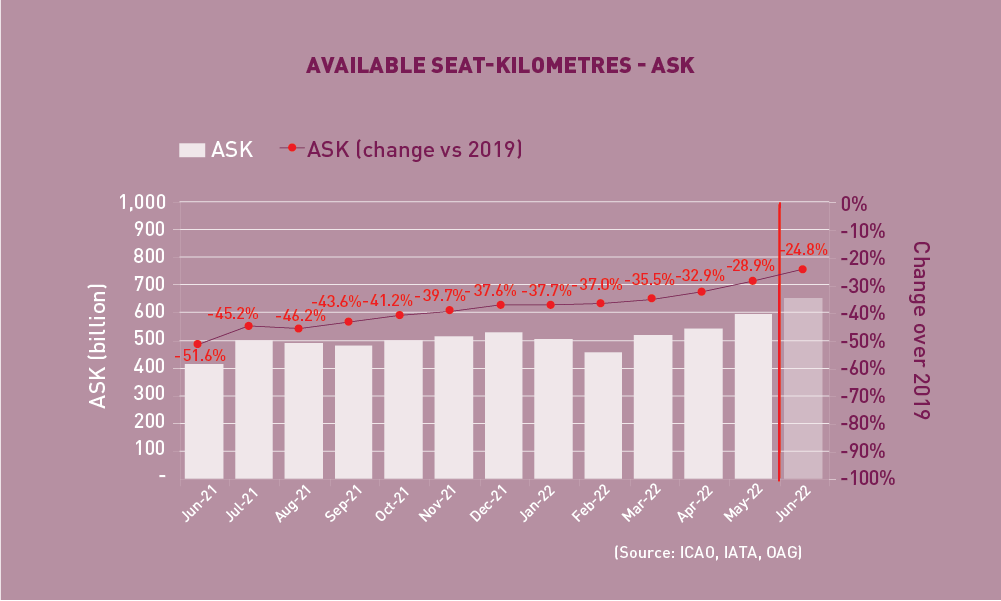
Capacity worldwide in May 2022 was -28.9% below the 2019 level, +4.0 percentage points up from the decline in the previous month (-32.9%). As air travel recovery continues, the capacity offered in June is expected to increase to -24.8% down from the 2019 level.
![]() Load Factor
Load Factor
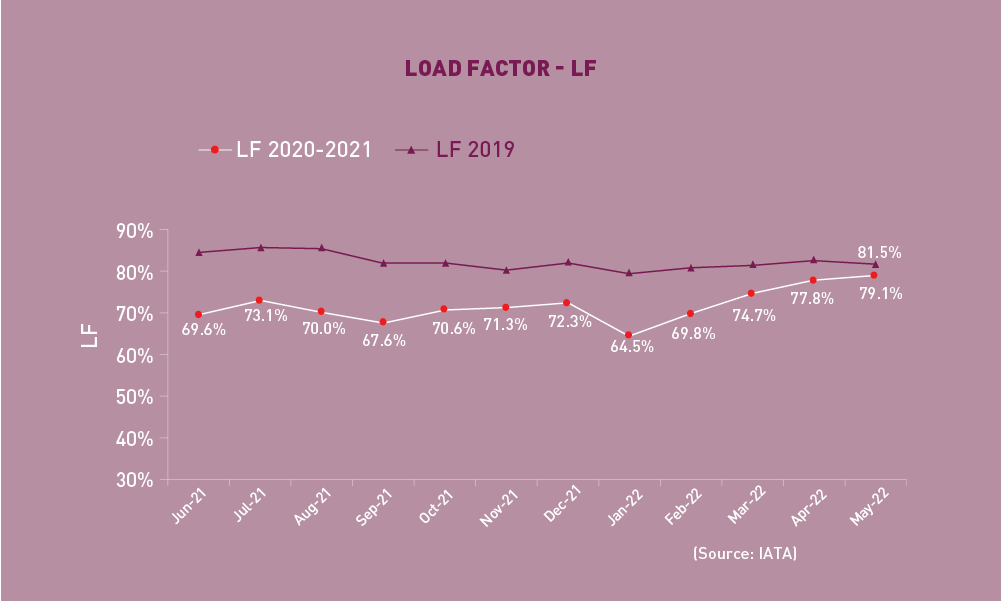
The passenger Load Factor reached 79.1% in May 2022, +1.3 percentage points higher than the previous month. Load factor climbed to pre-pandemic level, and the May level was merely -2.4 percentage points down compared to May 2019.
Cargo Traffic
![]() Cargo (Freight) Tonne-Kilometres – CTK
Cargo (Freight) Tonne-Kilometres – CTK
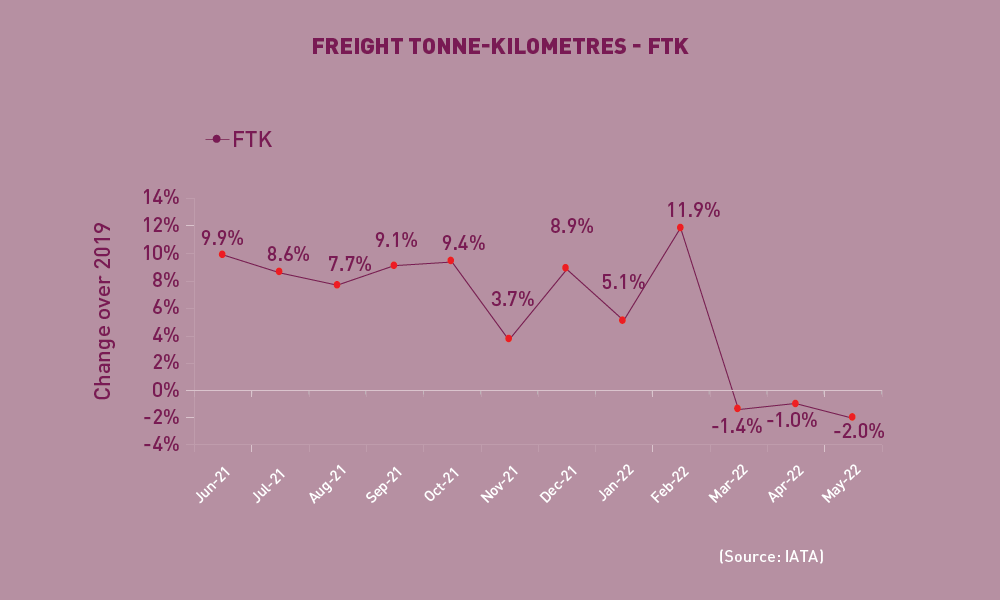
World cargo traffic in May 2022 was -2.0% below the 2019 level, -1.0 percentage point down from the decline in the previous month. Air cargo traffic remained on a sideways trend with a deterioration in the decline. The volatility in cargo traffic was attributed to multiple macroeconomic factors such as the softening in global trade and the ongoing disruptions on supply chain due to the war. Whereas Europe saw the most noticeable deterioration, Asia/Pacific was the only region recording month-on-month improvements, owing to the increasing manufacturing activities as the lockdown in China was eased. Despite the slowdown, North America and Africa continued to post positive growth over the pre-pandemic level.
Top 15 Airports (Ranked by aircraft departures, passengers, and volume of freight)
Note: Figures include total scheduled and non-scheduled services
May 2022: –9.4%, -11.4%, and +1.6% (vs. 2019) in terms of aircraft movements, passengers and freight for the Top 15
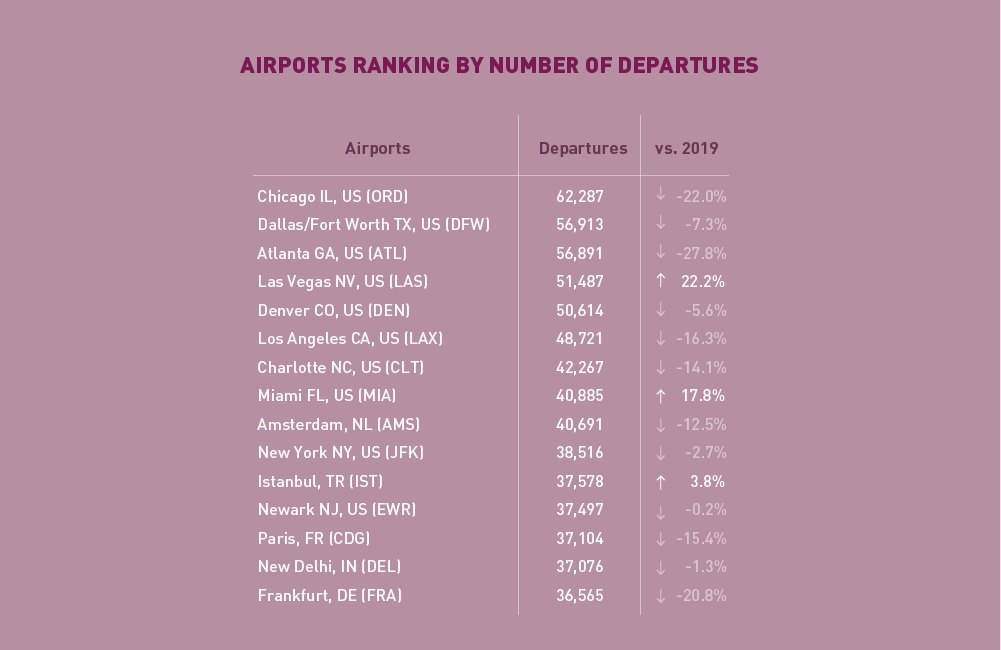 In terms of aircraft movements, the Top 15 airports reported a combined fall of -9.4%, compared to 2019. Ten out of the Top 15 airports were US airports. Chicago overtook Atlanta and ranked 1st, albeit with a decline of -22.0%. Atlanta became 3rd and recorded the largest decline of -27.8%. Three airports posted increases, i.e. Las Vegas, Miami, and Istanbul.
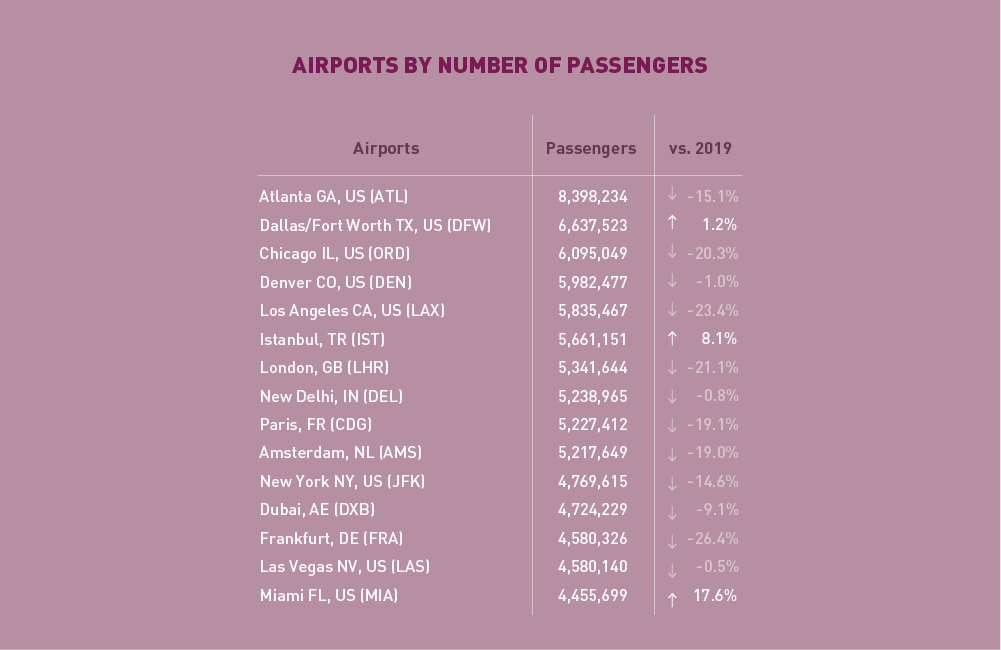
In terms of passengers, the Top 15 airports posted a total fall of -11.4%, compared to 2019. Over half of the Top 15 airports were US airports. Atlanta remained 1st with a decline of -15.1%. The largest fall was recorded by Frankfurt at -26.4%, followed by Los Angeles (-23.4%) and London Heathrow (-21.1%). Three airports posted increases, i.e. Miami, Istanbul, and Dallas/Fort Worth.

In terms of freight, the Top 15 airports reported an increase of +1.6%, compared to 2019. Ten out of the Top 15 airports posted an increase, including seven with double-digital growth. Anchorage recorded the strongest growth at +27.4%, followed by Los Angeles at +21.8%. Shanghai recorded the largest fall of -33.9%, followed by Memphis at -13.1%.
Top 15 Airline Groups (Ranked by RPK)
May 2022: –15.3% (vs. 2019) in terms of RPK for the Top 15
Chinese airlines were still out of the Top 15 list. The U.S. airlines retained the Top 3 positions, with American at 1st, followed by United and Delta. Rankings of Southwest, Jetblue and Alaska, however, dropped slightly. Airlines in Europe continued to show improvements supported by the surge in international travel, especially the Within Europe traffic. Both IAG and Lufthansa moved up 1 position from 4th to 5th. The performance of airlines in the Middle East was relatively stable. Emirates maintained the 8th position, while Qatar dropped 1 position to 11th. Singapore Airlines re-appeared in the Top 15 for the first time since the pandemic and ranked 14th with a decline of -36.2% in RPK from the 2019 level.
Capacity by Region
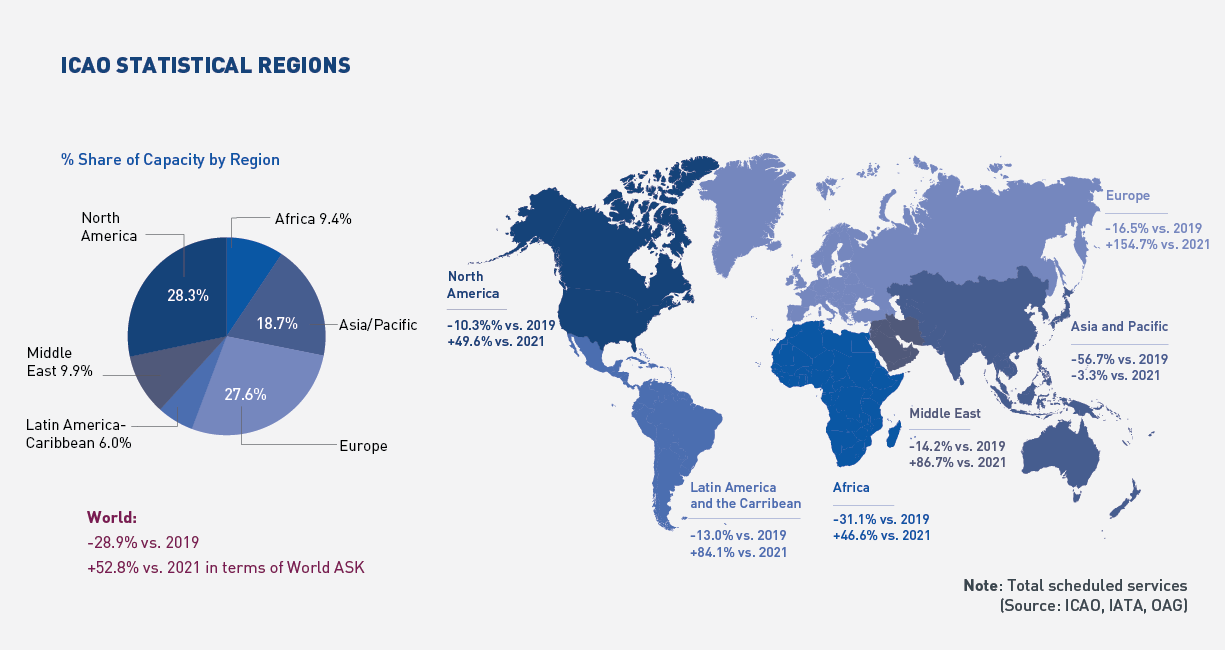
May 2022: -28.9% (vs. 2019) in terms of World ASK
Worldwide capacity contracted by -28.9% in May 2022, compared to 2019. Airlines continued to increase capacity in tandem with the rebound in travel demand. All regions posted smaller declines in capacity compared to the previous month. The most significant month-on-month improvement was recorded by the Middle East followed by Africa.
Click here to download the Monthly Monitor in a PDF version.
For any queries for further information, please contact the ICAO Economic Development (ECD), Air Transport Bureau ecd@icao.int
Acronyms: ACI: Airports Council International; ASK: Available Seat-Kilometres; IATA: International Air Transport Association; FTK: Freight Tonne-Kilometres; LF: Passenger Load Factor; OAG: Official Airline Guide; RPK: Revenue Passenger-Kilometres; UNWTO: World Tourism Organization; YoY: Year-on-year; YTD: Year-to-date.