The air transport industry is not only a vital engine of global socio-economic growth, but it is also of vital importance as a catalyst for economic development. Not only does the industry create direct and indirect employment and support tourism and local businesses, but it also stimulates foreign investment and international trade.
Informed decision-making is the foundation upon which successful businesses are built. In a fast-growing industry like aviation, planners and investors require the most comprehensive, up-to-date, and reliable data. ICAO’s aviation data/statistics programme provides accurate, reliable and consistent aviation data so that States, international organizations, aviation industry, tourism and other stakeholders can:
- make better projections;
- control costs and risks;
- improve business valuations; and
- benchmark performance.
The UN recognized ICAO as the central agency responsible for the collection, analysis, publication, standardization, improvement and dissemination of statistics pertaining to civil aviation. Because of its status as a UN specialized agency, ICAO remains independent from outside influences and is committed to consistently offering comprehensive and objective data. Every month ICAO produces this Air Transport Monitor, a monthly snapshot and analysis of the economic and aviation indicators.
ECONOMIC DEVELOPMENT – January 2021
World Results and Analyses for November 2020
Total Scheduled Services (Domestic and International)
Passenger traffic
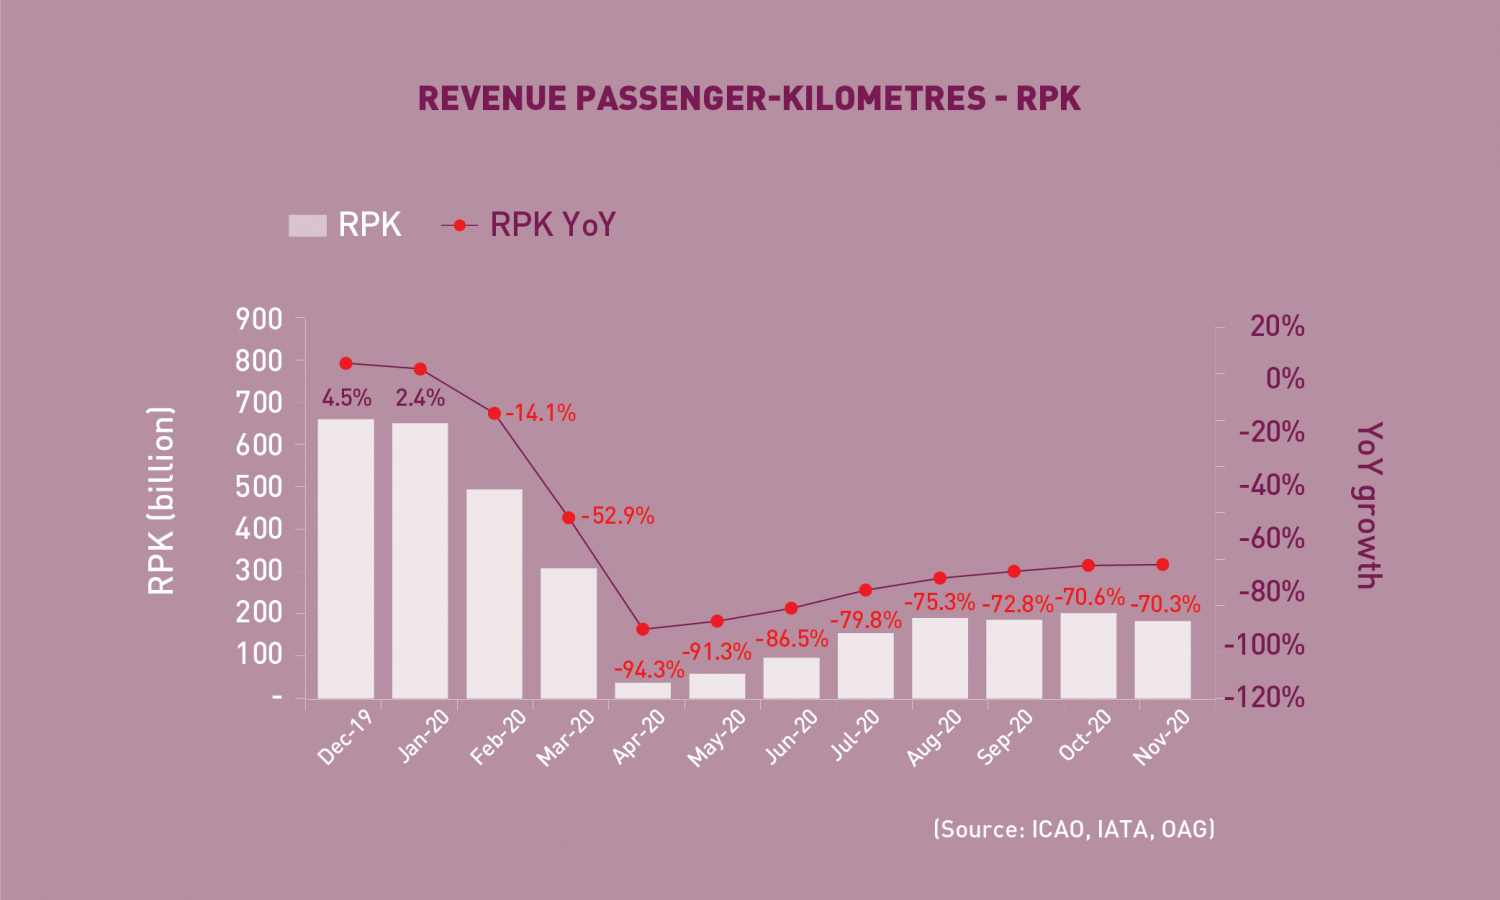
Revenue Passenger-Kilometres – RPK
World passenger traffic fell by -70.3% YoY in November 2020, +0.3 percentage point up from the decline in the previous month. Air travel recovery was hampered by the resurgence in outbreaks and the resulting reimposition of restrictions. The impact on regions was a mix. Whereas Europe recorded a deterioration in traffic, other regions ticked up somewhat with Latin America/Caribbean showing the fastest improvements. Domestic travel recovery in China continued to be the best performing market albeit with a slight slowdown.
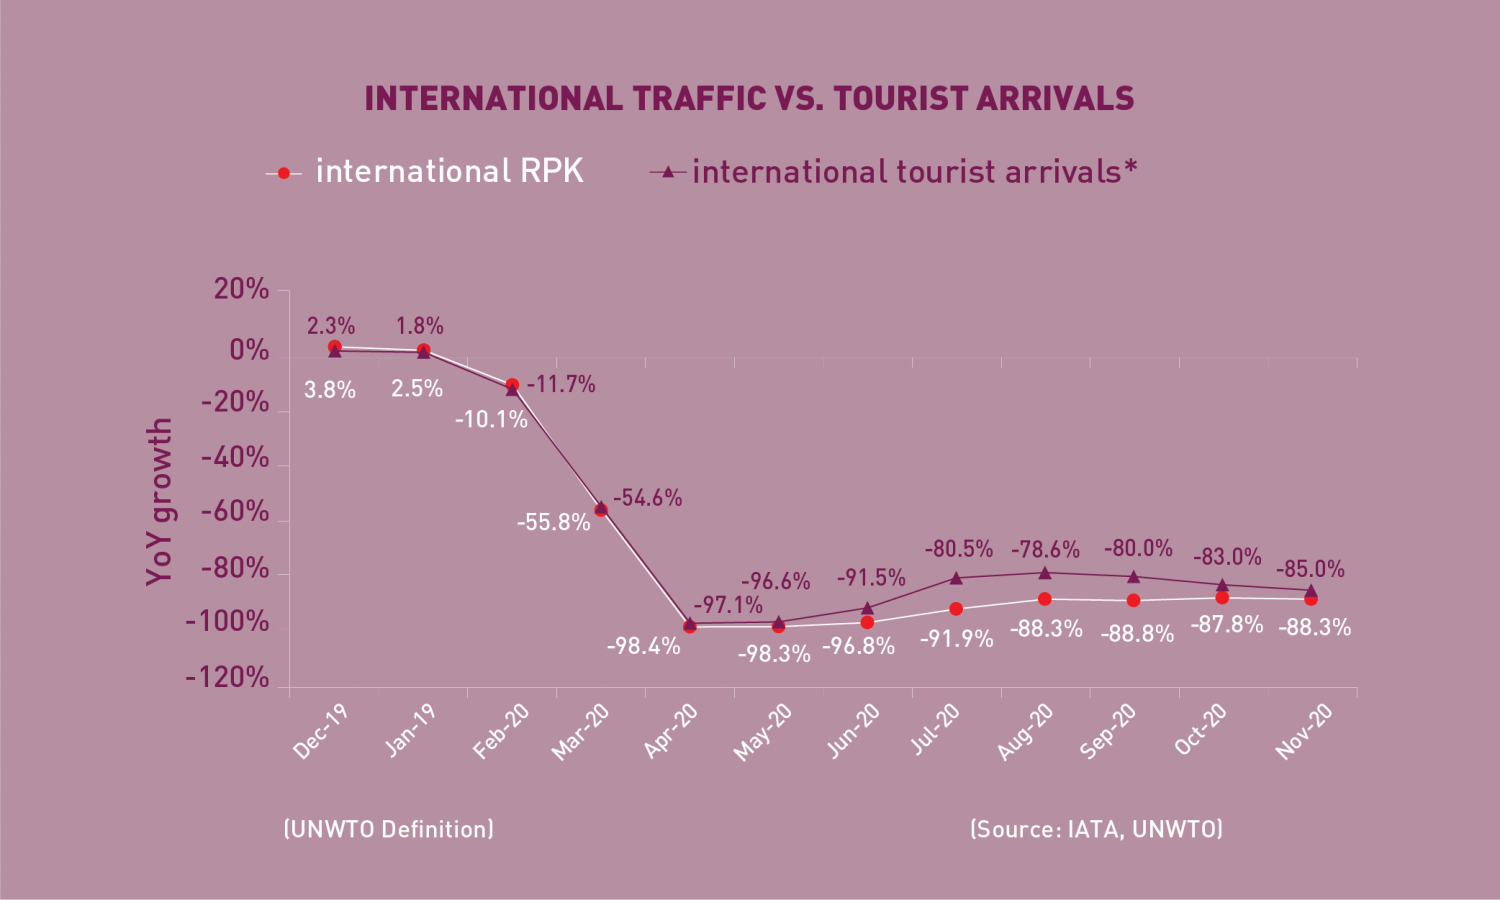 International Traffic vs. Tourist Arrivals
International passenger traffic fell by -88.3% YoY in November 2020, -0.5 percentage point down from the decline in the previous month. Recovery in international travel further weakened mainly due to the larger fall in Intra-Europe traffic.
The international tourist arrivals also remained stagnant and followed a similar trend as international passenger traffic.
Capacity![]()
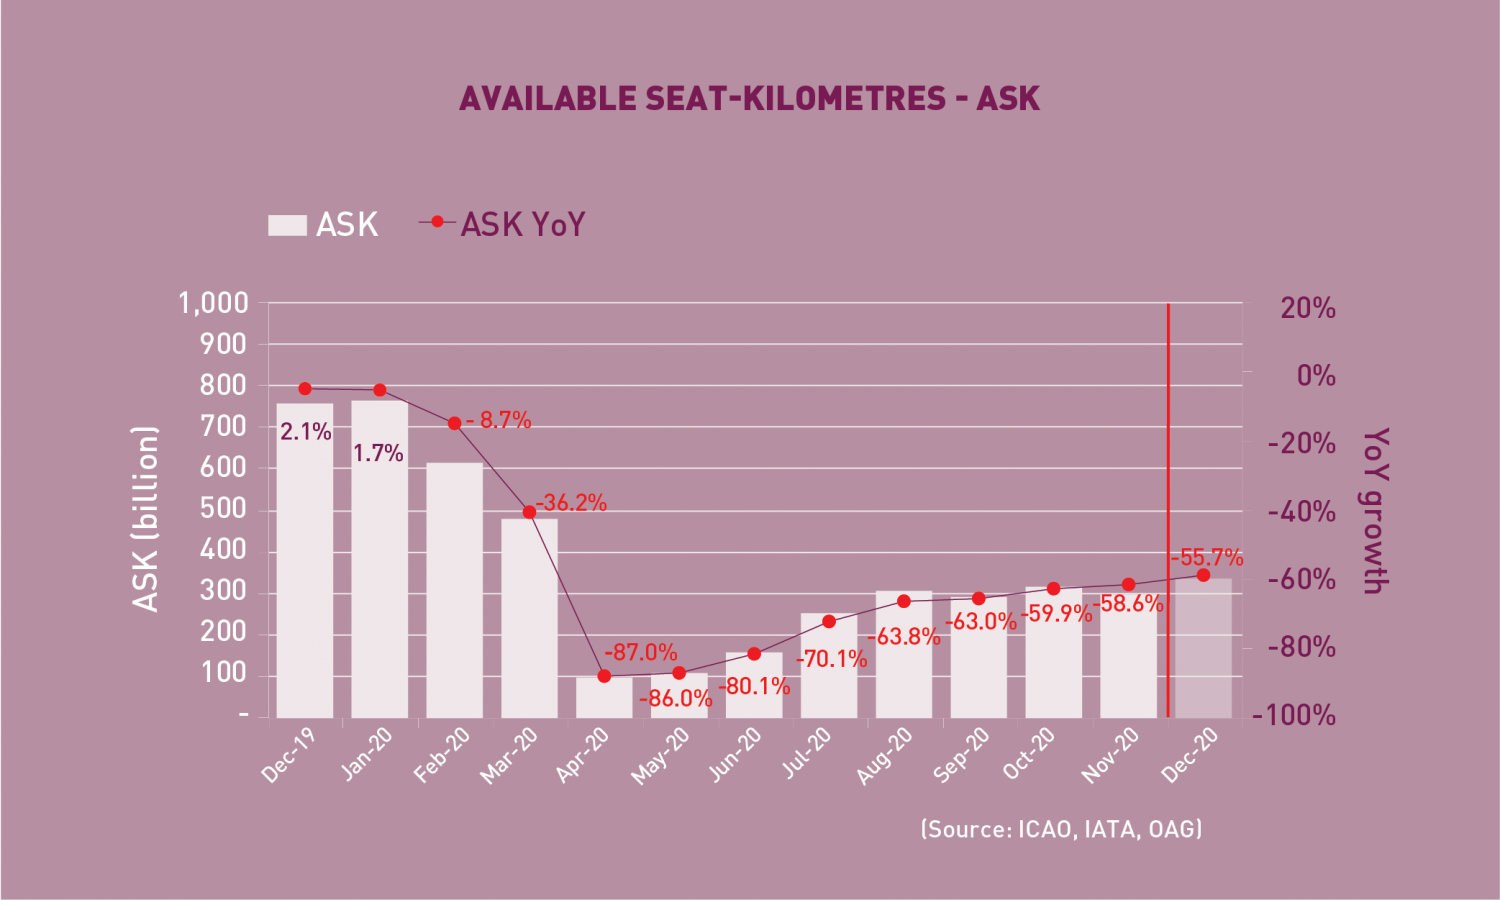
Available Seat-Kilometres – ASK
Capacity worldwide fell by -58.6% YoY in November 2020, +1.3 percentage points up from the decline in the previous month (-59.9%). Approaching the end-of-year travel period, airlines are expected to add more capacity. As a result, capacity contraction in December would ease to -55.7% YoY.
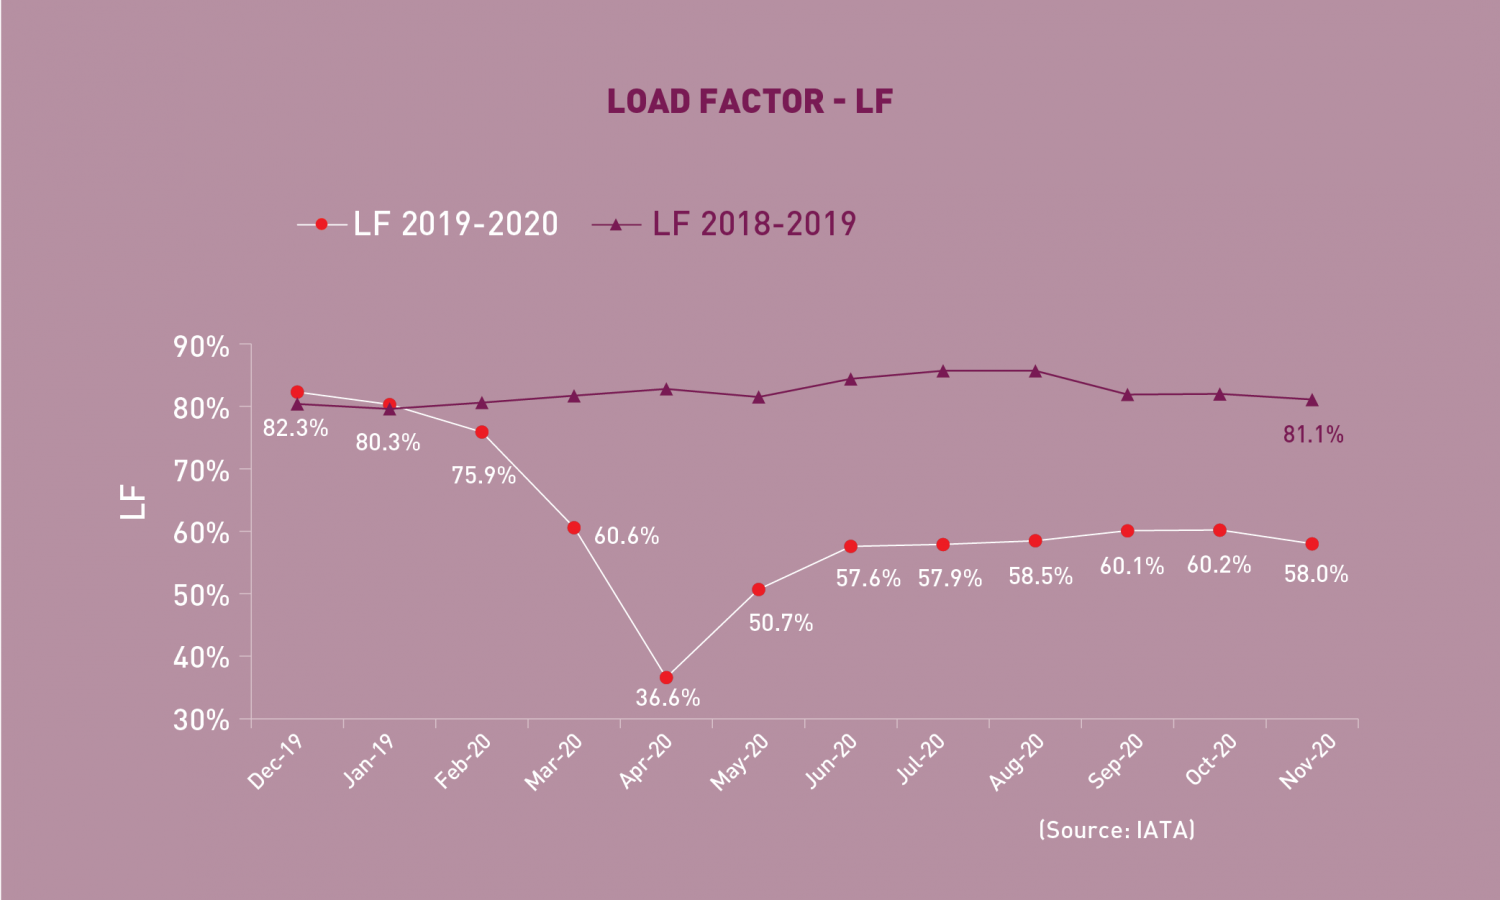
Load Factor
The passenger Load Factor reached 58.0% in November 2020, -2.2 percentage points lower than the previous month. As the decline in air travel demand was deeper than the capacity cut, the November LF was -23.1 percentage points lower than the rate in the same period of 2019.
Freight Traffic
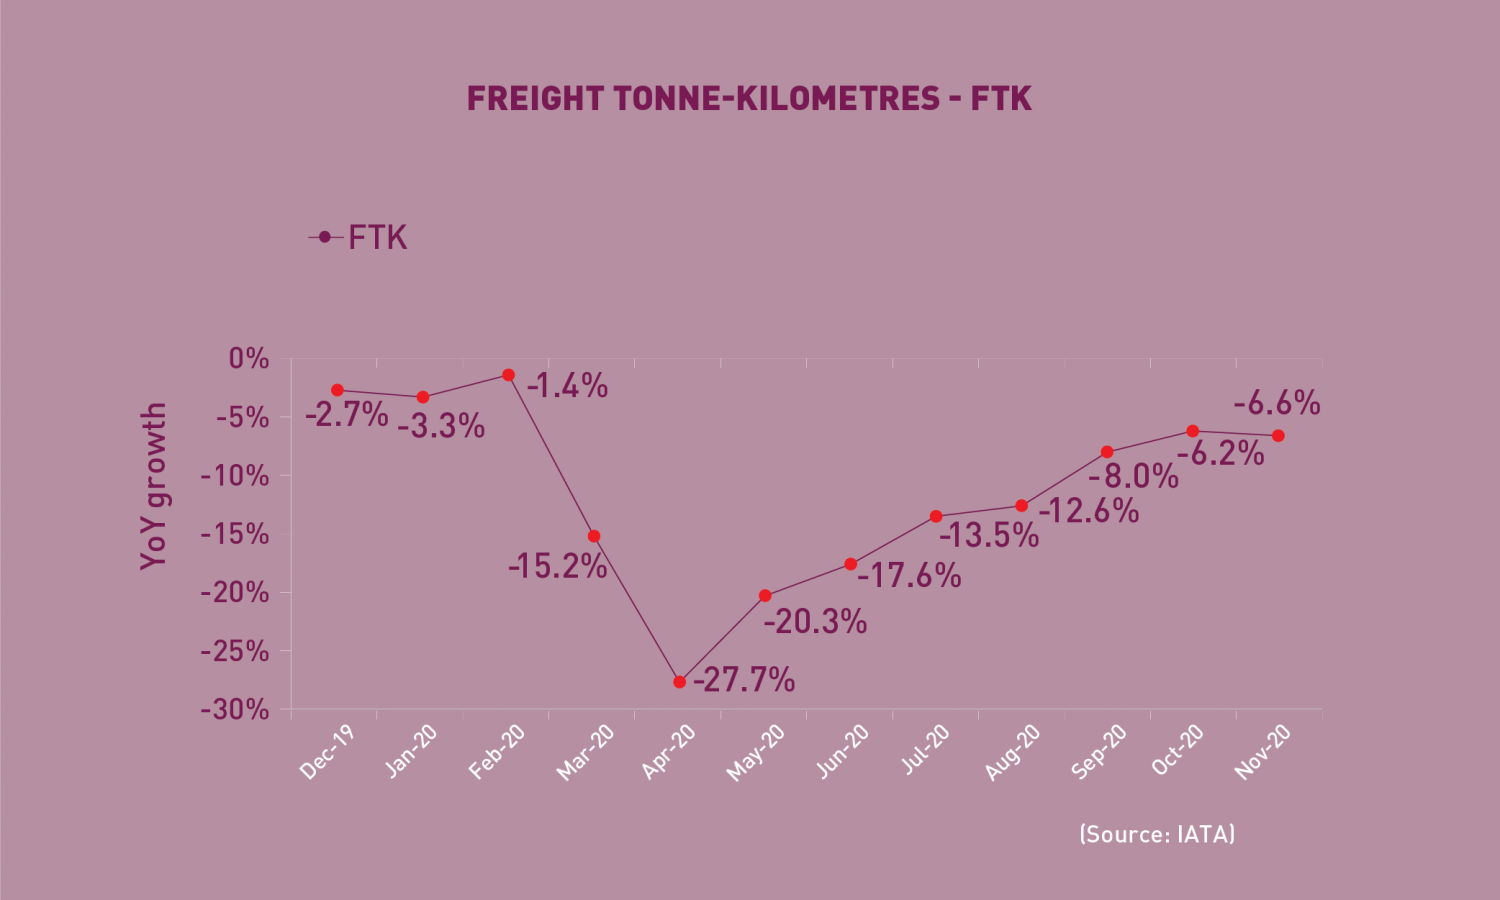
Freight Tonne-Kilometres – FTK
World freight traffic reported a decline of -6.6% YoY in November 2020, -0.4 percentage point down from the fall in the previous month. Air cargo recovery softened slightly as the virus resurgence had affected demand in certain markets. On the other hand, demand in air cargo in November also benefitted from the peak e-commerce events such as Black Friday and Double 11. Overall, recovery in air cargo stalled since the improvements in Asia/Pacific were offset by the setbacks in other regions, particularly in Latin America/Caribbean and Europe. Nevertheless, expectations for December remain optimistic as the economic recovery will likely continue and the consumer consumption during the holiday shopping season will also be supportive.
Top 15 Airports (Ranked by aircraft departures, passengers, and volume of freight)
Note: Figures include total scheduled and non-scheduled services
November 2020: -25.3%, -38.4%, and +6.0% YoY in terms of aircraft departures, passengers, and freight for the Top 15
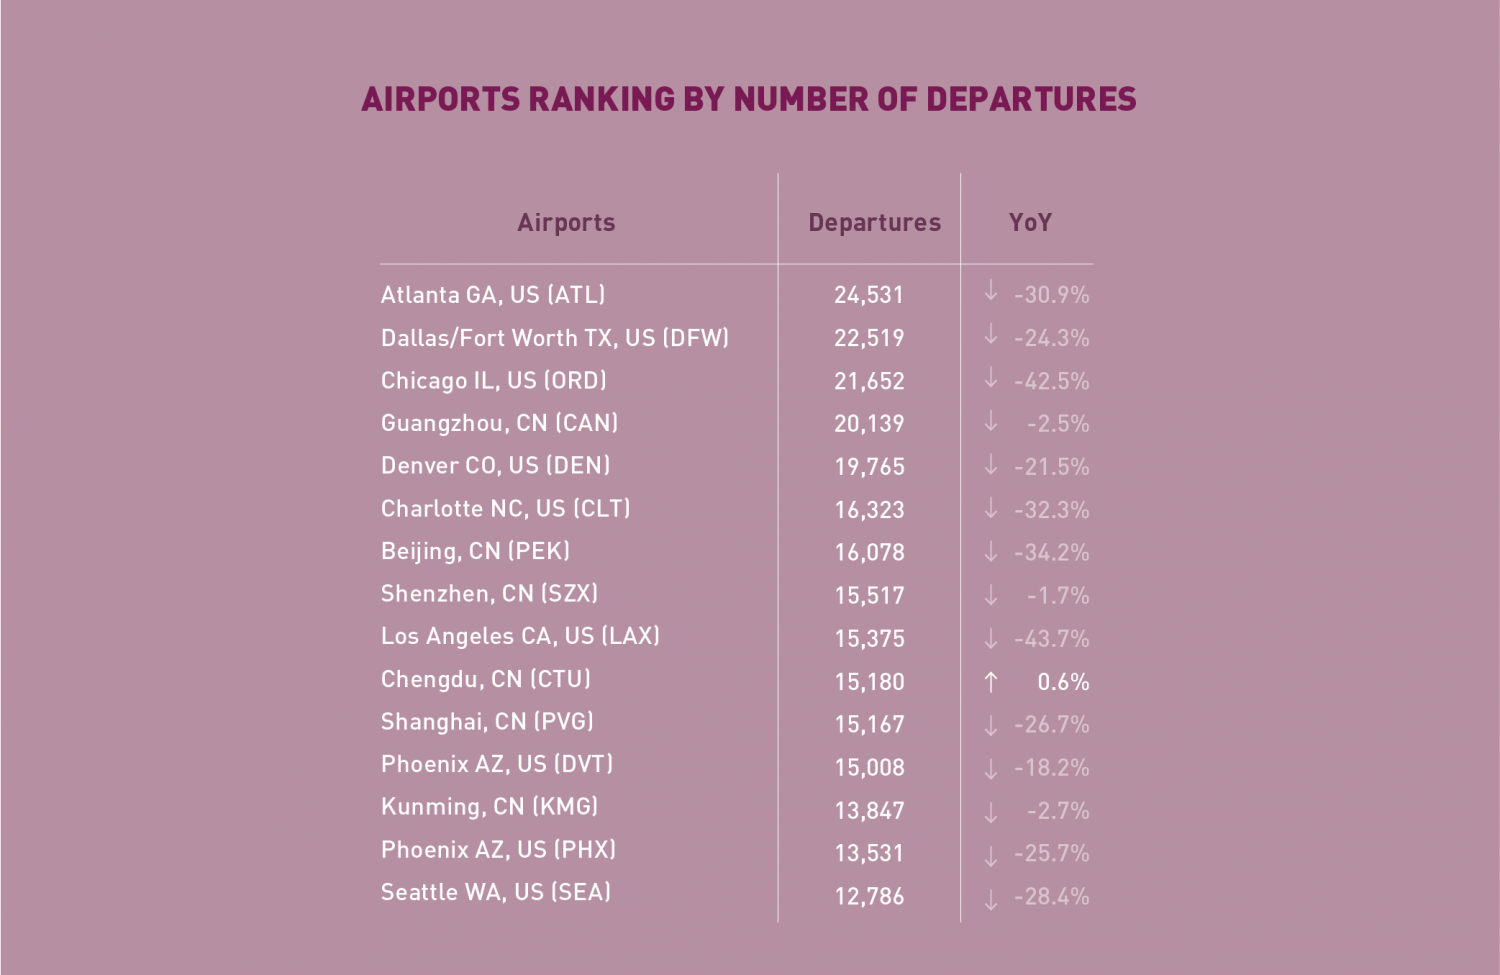
In terms of aircraft departures, the Top 15 airports reported a combined fall of -25.3% YoY. The Top 15 list was still dominated by US and Chinese airports. Chengdu became the only airport reporting positive growth (+0.6%), and for the third consecutive month. Atlanta ranked 1st with -30.9% decline, followed by Dallas/Fort Worth and Chicago.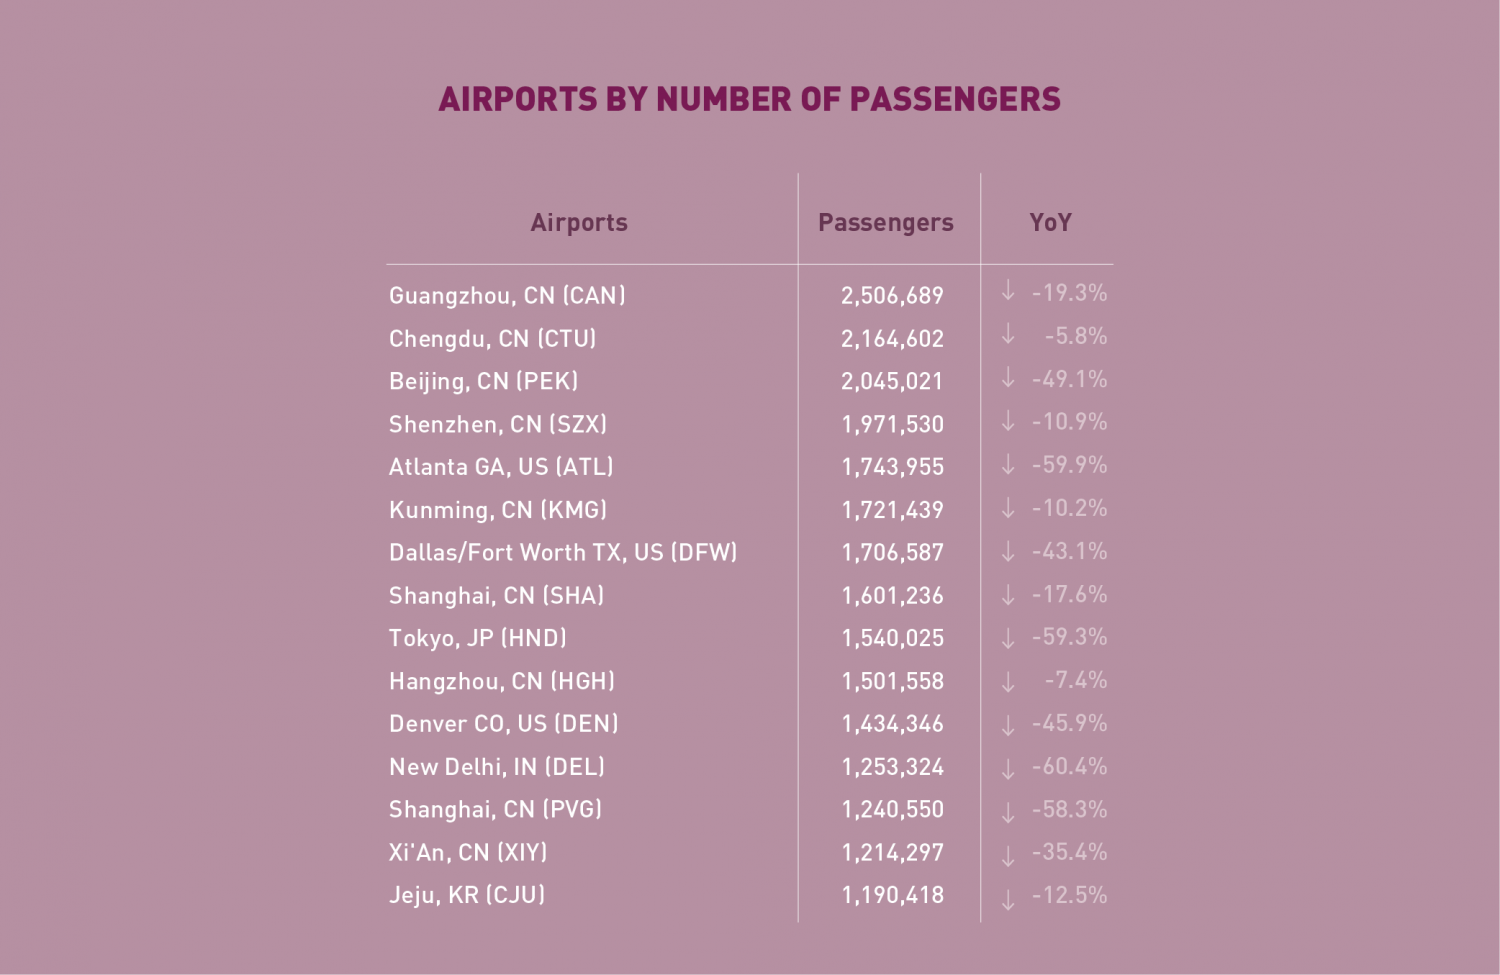
In terms of passengers, the Top 15 airports posted a total fall of -38.4% YoY. The majority of the Top 15 airports were in Asia/Pacific, with over half being Chinese airports. Guangzhou retained 1st place, followed by Chengdu and Beijing. Significant improvement was observed in Tokyo supported by the domestic Go-To Travel campaign. New Delhi, Jeju, and three US airports also ranked in the Top 15.
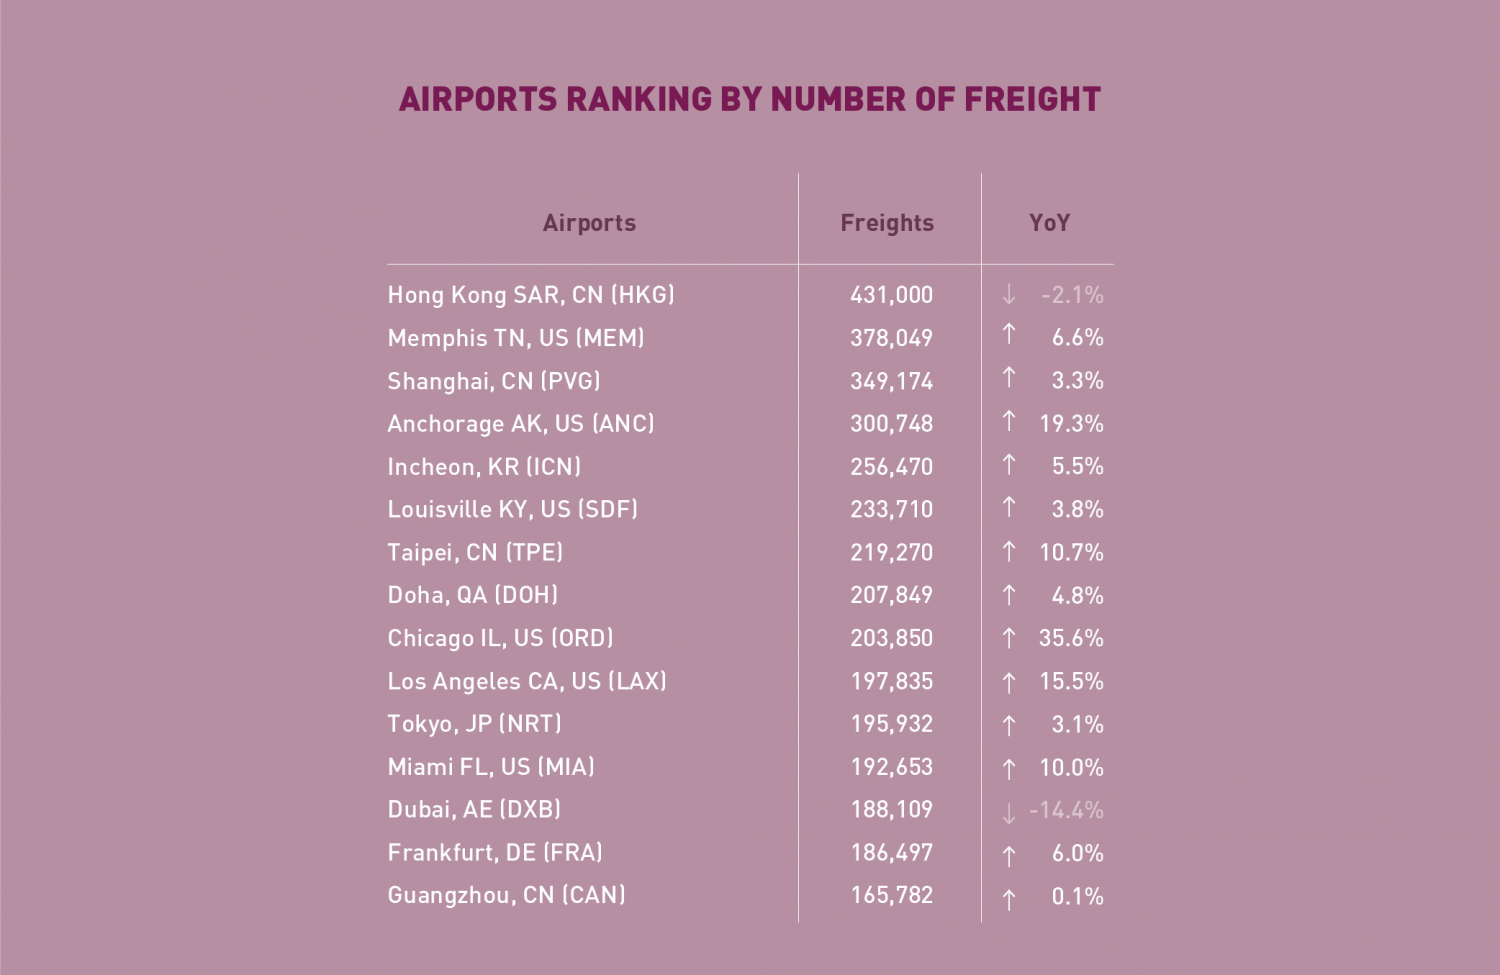
In terms of freight, the Top 15 airports reported a YoY increase of +6.0%, recording sixth consecutive monthly growth since June. Only two airports, Hong Kong and Dubai, posted declines. The former, however, overtook Memphis and became 1st. The strongest expansion was recorded by Chicago (+35.6%), followed by Anchorage (+19.3%).
Top 15 Airline Groups (Ranked by RPK)
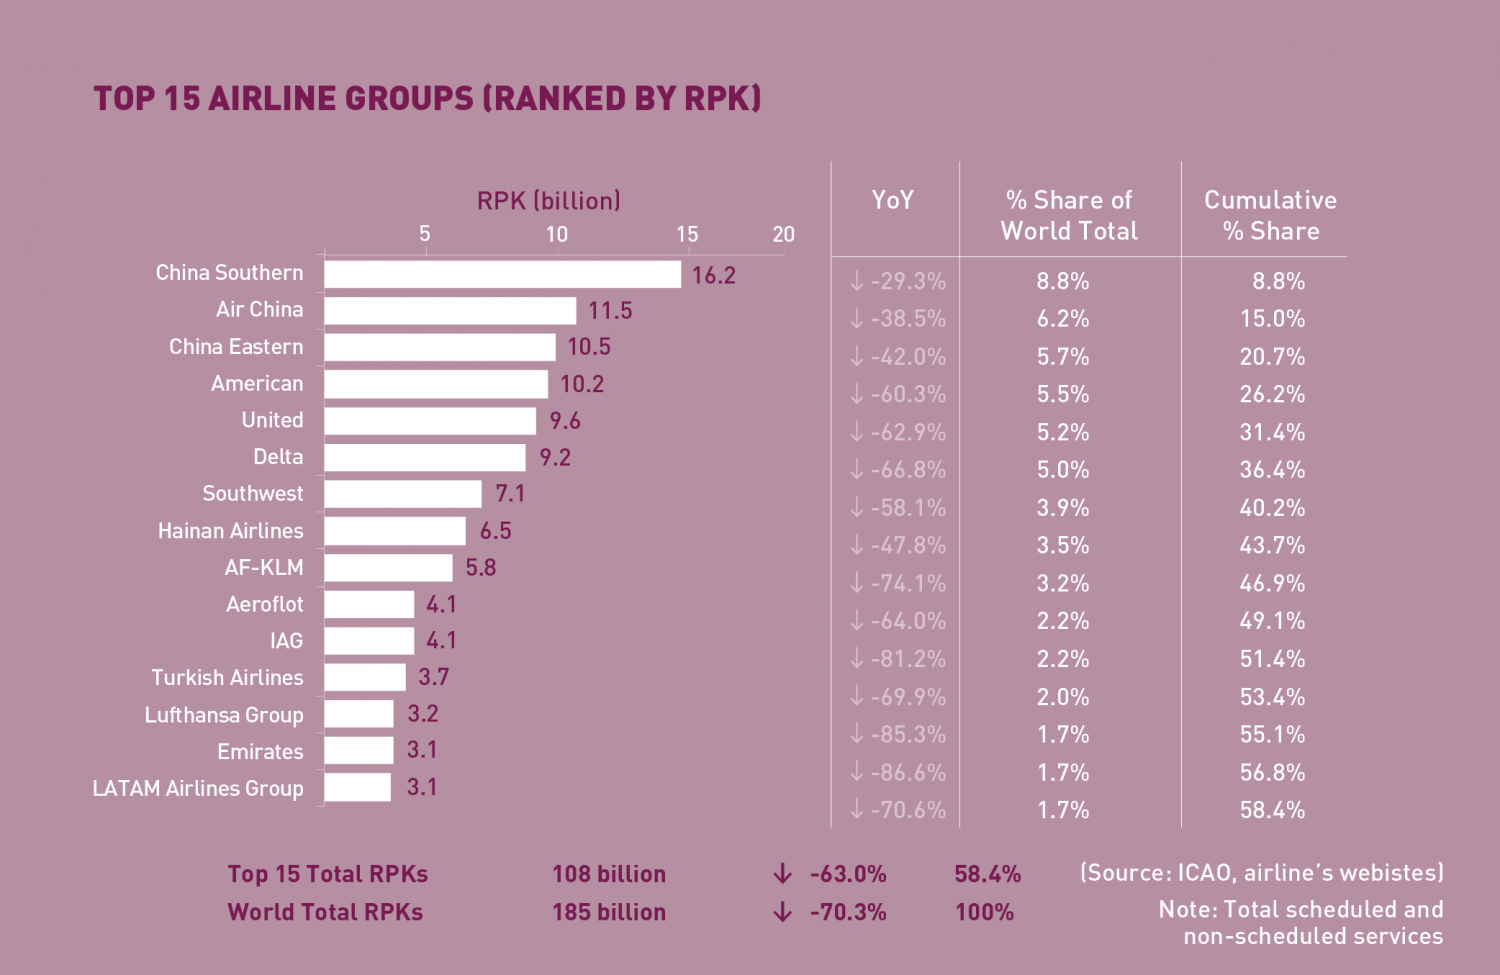
November 2020: -63.0% in terms of RPK for the Top 15
In terms of RPK, the Top 15 airline groups accounted for 58.4% of the world’s total RPK in November 2020 and declined by –63.0% YoY. This decline was 7.3 percentage points smaller than the fall in world’s average RPK, with all airlines in the Top 15 posting contractions.
Top 15 ranking fluctuated in the month of November due to the uneven impact of the renewed outbreaks on air travel recovery across regions.
China Southern, Air China, and China Eastern retained the Top 3 positions and demonstrated the most resilience within the Top 15, albeit with slight moderation. Hainan Airlines climbed up one position to 8th while maintaining a similar level of traffic as the previous month.
Four US airlines, American, United, Delta and Southwest, occupied the places of 4th to 7th, with YoY traffic decline ranging from -58 to -67% – slight improvements from October owing to the increased travel during Thanksgiving holidays. Southwest ranked one position up to 7th, improving faster than the other three US airlines.
Airlines in Europe saw further deterioration in traffic recovery, impacted by the surge in COVID-19 cases and the associated more strict measures. Five airlines in the region ranked between 9th and 13th. AF-KLM dropped two positions to 9th, whereas the others stayed relatively stable.
For the first time since April 2020, Emirates and LATAM reappeared in the Top 15, and ranked at 14th and 15th, respectively.
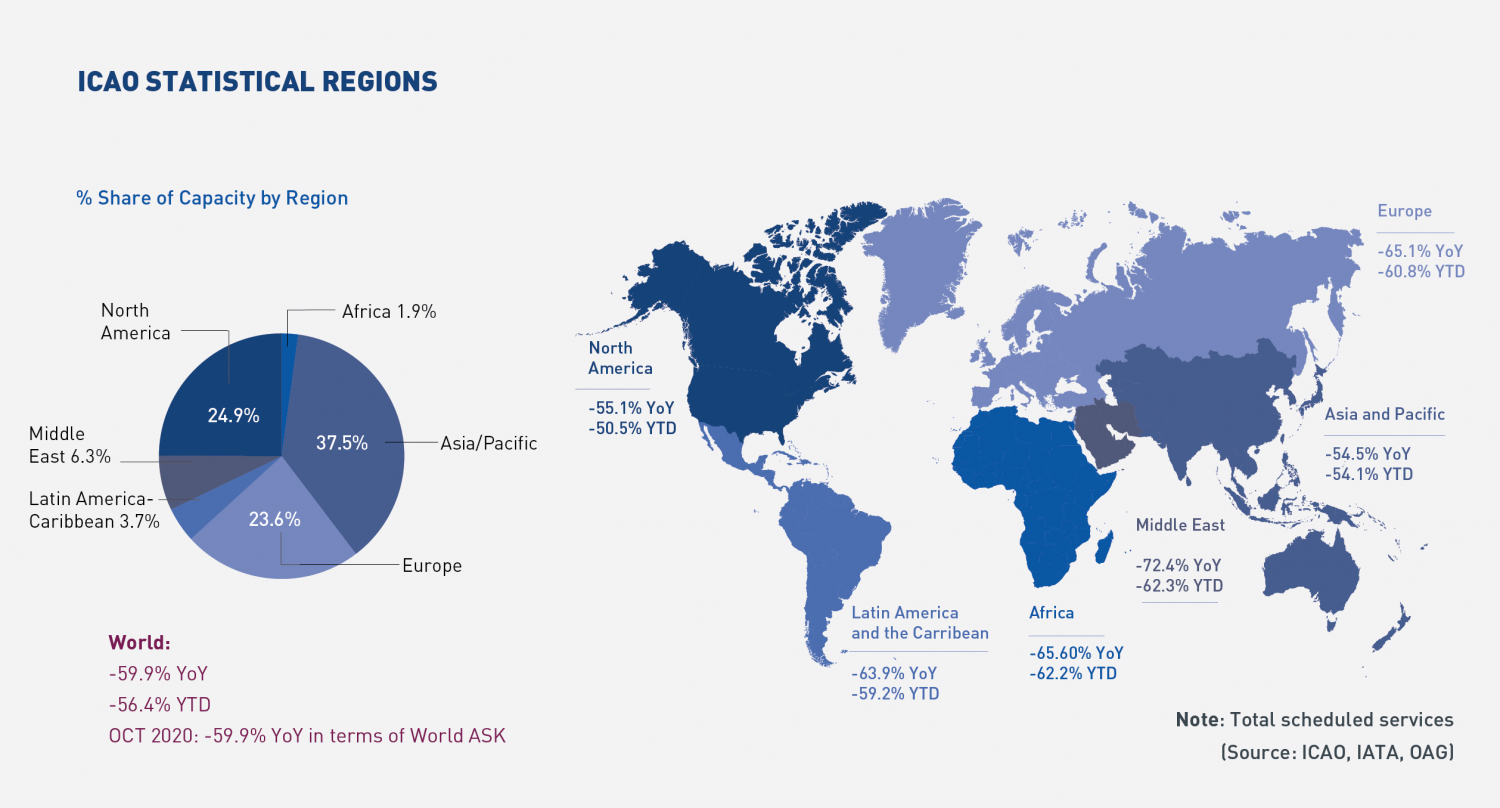
Worldwide capacity contracted by -58.6% YoY in November 2020. All regions saw increases in capacity, except for Europe where further reduction was shown, severely impacted by the elevated infection rates.
The fastest increase in capacity was recorded by Latin America/Caribbean and North America; the latter also showed the smallest capacity declines among all regions.
Click here to download the Monthly Monitor January PDF version.
For any queries for further information, please contact the ICAO Economic Development (ECD), Air Transport Bureau ecd@icao.int
Acronyms: ACI: Airports Council International; ASK: Available Seat-Kilometres; IATA: International Air Transport Association; FTK: Freight Tonne-Kilometres; LF: Passenger Load Factor; OAG: Official Airline Guide; RPK: Revenue Passenger-Kilometres; UNWTO: World Tourism Organization; YoY: Year-on-year; YTD: Year-to-date.