The air transport industry is not only a vital engine of global socio-economic growth, but it is also of vital importance as a catalyst for economic development. Not only does the industry create direct and indirect employment and support tourism and local businesses, but it also stimulates foreign investment and international trade.
Informed decision-making is the foundation upon which successful businesses are built. In a fast-growing industry like aviation, planners and investors require the most comprehensive, up-to-date, and reliable data. ICAO’s aviation data/statistics programme provides accurate, reliable and consistent aviation data so that States, international organizations, aviation industry, tourism and other stakeholders can:
- make better projections;
- control costs and risks;
- improve business valuations; and
- benchmark performance.
The UN recognized ICAO as the central agency responsible for the collection, analysis, publication, standardization, improvement and dissemination of statistics pertaining to civil aviation. Because of its status as a UN specialized agency, ICAO remains independent from outside influences and is committed to consistently offering comprehensive and objective data. Every month ICAO produces this Air Transport Monitor, a monthly snapshot and analysis of the economic and aviation indicators.
ECONOMIC DEVELOPMENT – February 2021
World Results and Analyses for December 2020
Total Scheduled Services (Domestic and International)
Passenger traffic
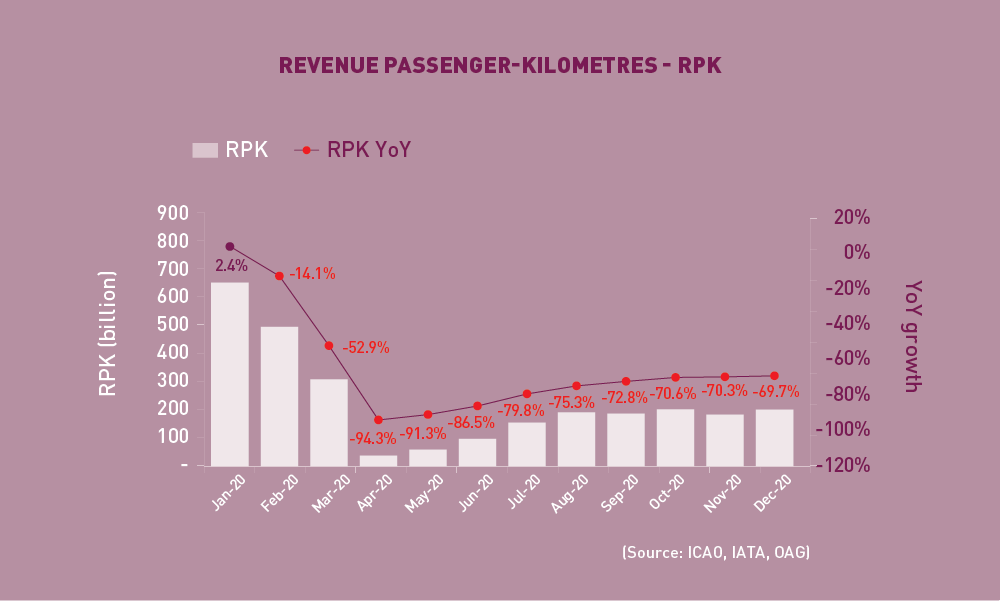
Revenue Passenger-Kilometres – RPK
World passenger traffic fell by -69.7% YoY in December 2020, +0.6 percentage point up from the decline in the previous month. Elevated COVID-19 cases and the resulting travel restrictions continued to weigh on air travel. Subsequent to the initial rebound from the lowest point in April throughout the summer, passenger traffic recovery has stalled with several months of moderate improvements. For 2020 as a whole, the total number of passengers was down -60% YoY to 1.8 billion, back to 2003 levels. China domestic traffic demonstrated the swiftest recovery among all markets.
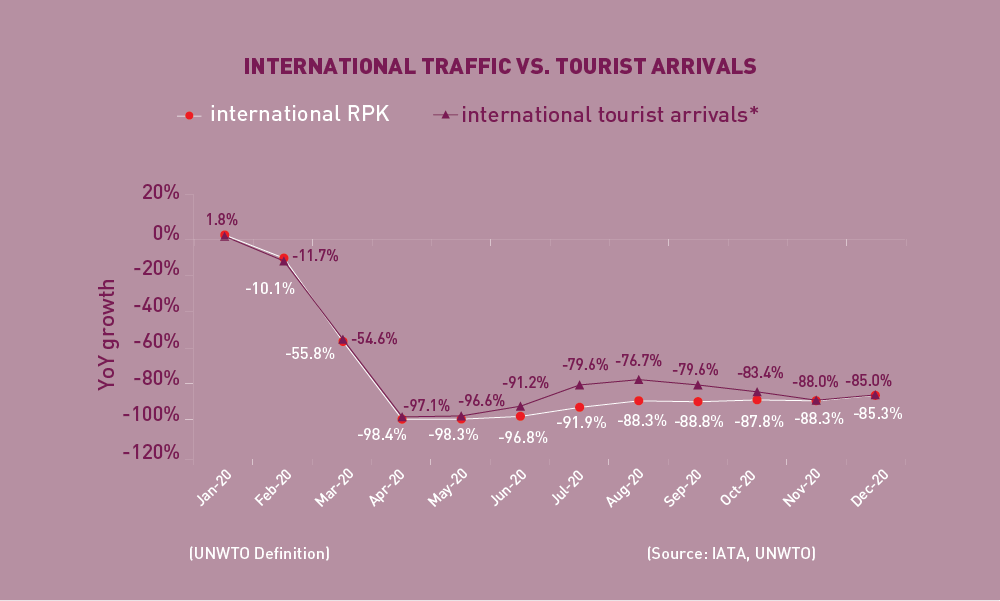 International Traffic vs. Tourist Arrivals
International passenger traffic fell by -85.3% YoY in December 2020, +3.0 percentage points up from the decline in the previous month. There have been no clear signs of improvement in international travel since the peak of the crisis in April. The number of international passengers in 2020 was far below 2019 levels and was down -74% YoY.
The international tourist arrivals also remained stagnant and followed a similar trend as international passenger traffic.
Capacity

Available Seat-Kilometres – ASK
Capacity worldwide fell by -56.7% YoY in December 2020, +1.9 percentage points up from the decline in the previous month (-58.6%). In response to the renewed outbreaks across the world and ease of peak holiday travel, the capacity decline in January 2021 is expected to accelerate to -58.0% YoY.
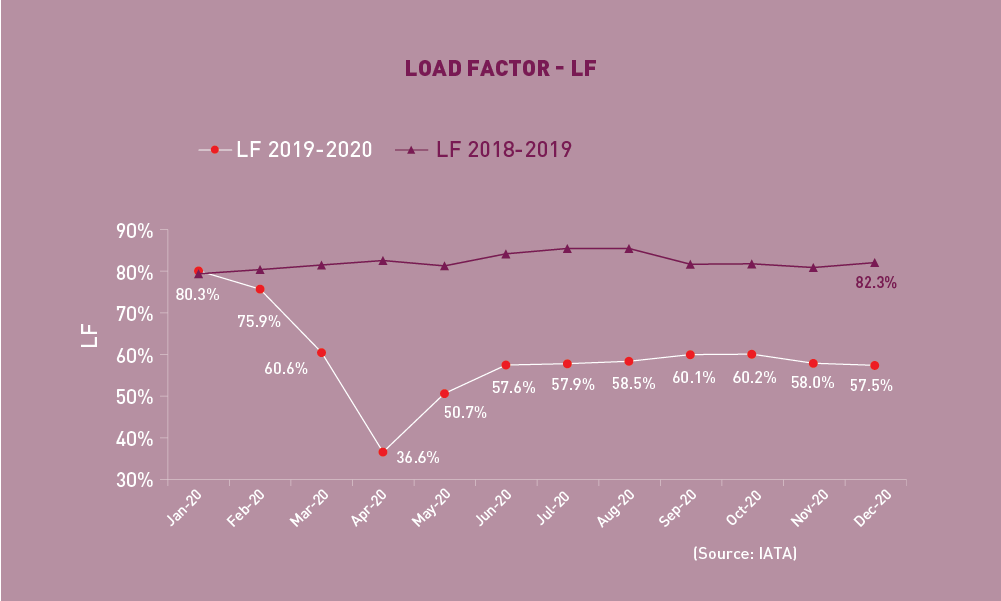
Load Factor
The passenger Load Factor reached 57.5% in December 2020, -0.5 percentage point lower than the previous month. As the decline in air travel demand was faster than the capacity cut, the December LF was -24.8 percentage points lower than the rate in the same period of 2019.
Freight Traffic
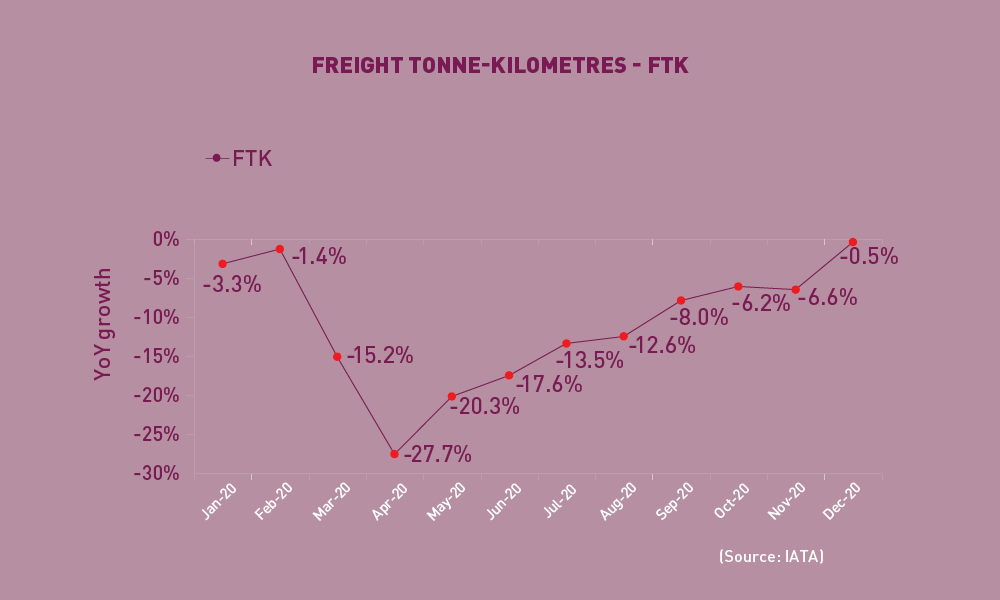
Freight Tonne-Kilometres – FTK
World freight traffic reported a decline of -0.5% YoY in December 2020, +6.1 percentage points up from the fall in the previous month. December marked another month of a robust rebound in air cargo with traffic recovering to over 99% of the pre-crisis levels. In contrast to the depressed air travel, cargo traffic recovered swiftly benefiting from the continued demand for goods and supplies during the pandemic. Overall, air cargo traffic fell by -10.6% YoY in 2020, much lower than the decline in passenger traffic. Solid improvements were observed in all regions, specifically in Africa and North America, where traffic has already bounced back to 2019 levels and achieved positive growth.
Top 15 Airports (Ranked by aircraft departures, passengers, and volume of freight)
Note: Figures include total scheduled and non-scheduled services
December 2020: –26.6%, -41.3%, and +8.0% YoY in terms of aircraft departures, passengers, and freight for the Top 15
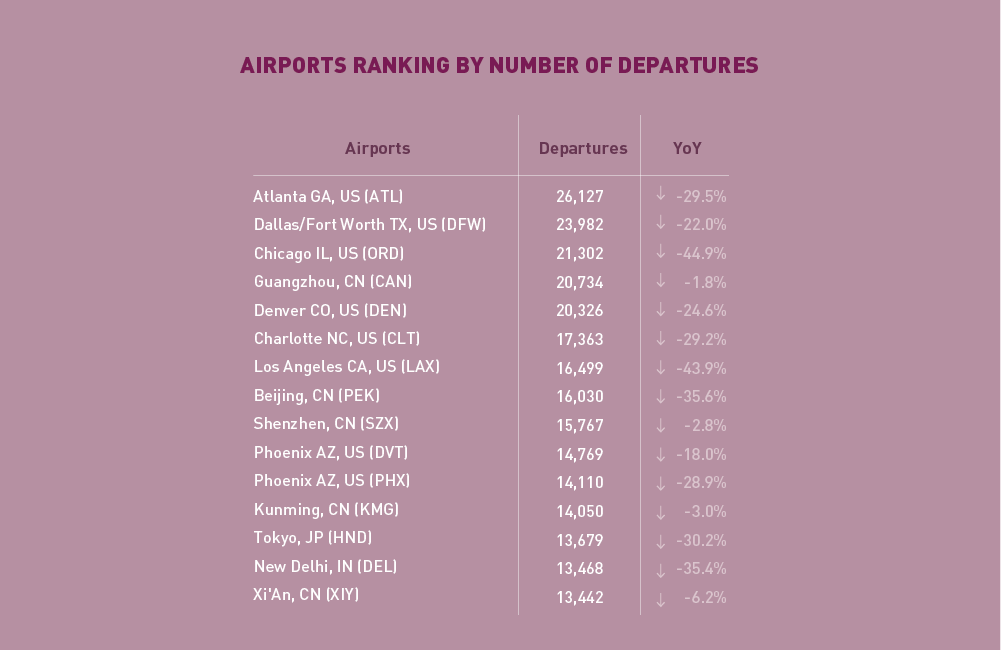
In terms of aircraft departures, the Top 15 airports reported a combined fall of -26.6% YoY. While US and Chinese airports continued to dominate the Top 15, Tokyo and New Delhi, appeared on the list for the first time since May 2020. Atlanta ranked 1st with -29.5% decline, followed by Dallas/Fort (-22.0%). Guangzhou reported the smallest fall at -1.8%, followed by Shenzhen (-2.8%).
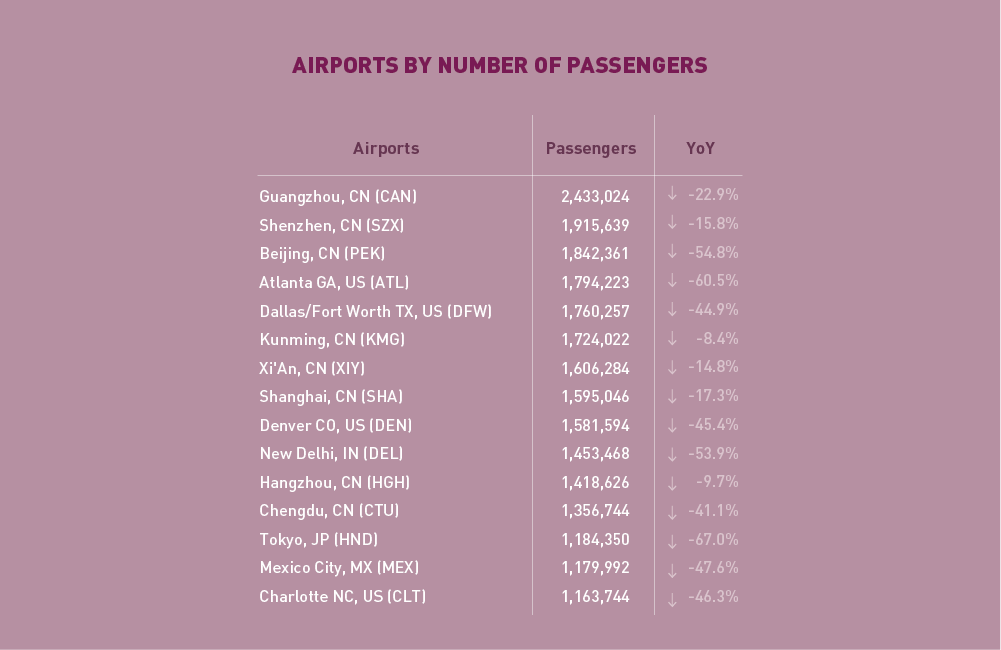
In terms of passengers, the Top 15 airports posted a total fall of -41.3% YoY. Ten airports in Asia/Pacific ranked in the Top 15, including eight Chinese airports, New Delhi and Tokyo. Guangzhou retained 1st place, followed by Shenzhen and Beijing. Kunming and Hangzhou reported the smallest contraction at around less than -10%. Mexico City made it to the list for the first time since 2020.
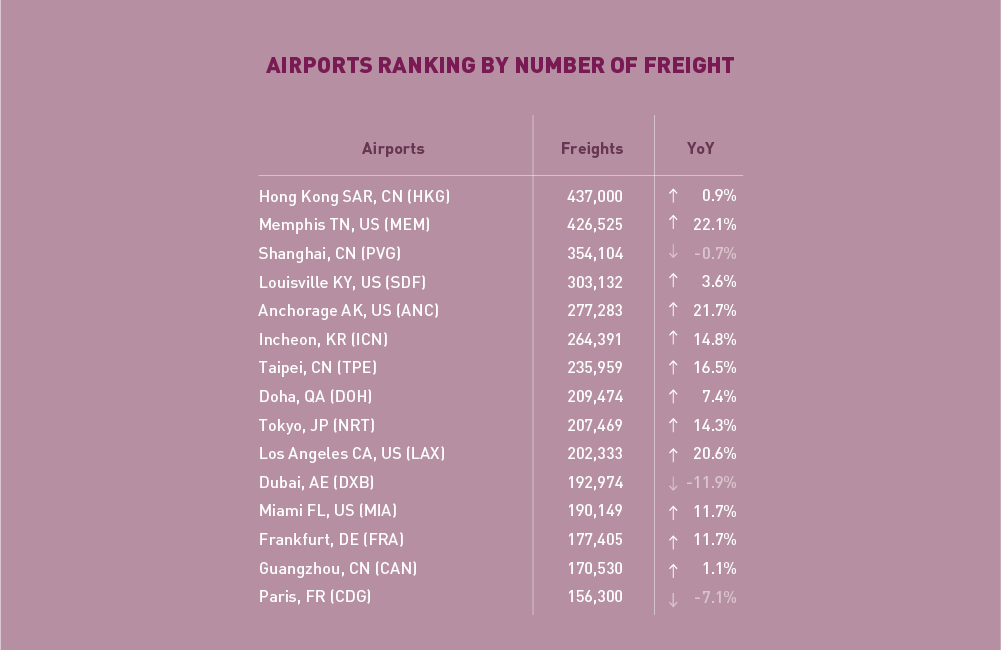
In terms of freight, the Top 15 airports reported a YoY increase of +8.0%, recording the seventh consecutive monthly growth since June. The majority of the Top 15 recorded YoY growth, except for Shanghai, Dubai, and Paris. Hong Kong rose marginally at +0.9% while retained the 1st position. US airports recorded stronger growth overall, with Memphis up by +22.1%.
Top 15 Airline Groups (Ranked by RPK)

December 2020: –63.3% YoY in terms of RPK for the Top 15
In terms of RPK, the Top 15 airline groups accounted for 55.3% of the world’s total RPK in December 2020 and declined by –63.3% YoY. This decline was 6.4 percentage points smaller than the fall in the world’s average RPK, with all airlines in the Top 15 posting contractions.
The Top 15 airline list was the same as November, nonetheless, rankings fluctuated due to the epidemic divergence across countries. The top 7 were dominated by airlines in China and the US, the two largest domestic markets.
The three major Chinese airlines reported moderated recovery due to the new outbreaks and resulting restrictions, but they still demonstrated the strongest resilience. China Southern and Air China retained the Top 2 positions while China Eastern slipped to 4th. Hainan Airlines moved one position down to 9th; however, it recorded the fastest recovery among the Top 15.
For the first time since the lowest point in April, American ranked within the Top 3, surpassed China Eastern. United, Delta, and Southwest occupied the places of 5th to 7th, with YoY traffic decline at around -60%, a slight slowdown from November.
Traffic declines of airlines in Europe eased somewhat owing to increased travel during the holiday season. AF-KLM climbed up one position to 8th, whereas the others dropped one position and ranked between 11th and 14th.
Both Emirates and LATAM posted smaller falls and ranked 10th and 15th, respectively.
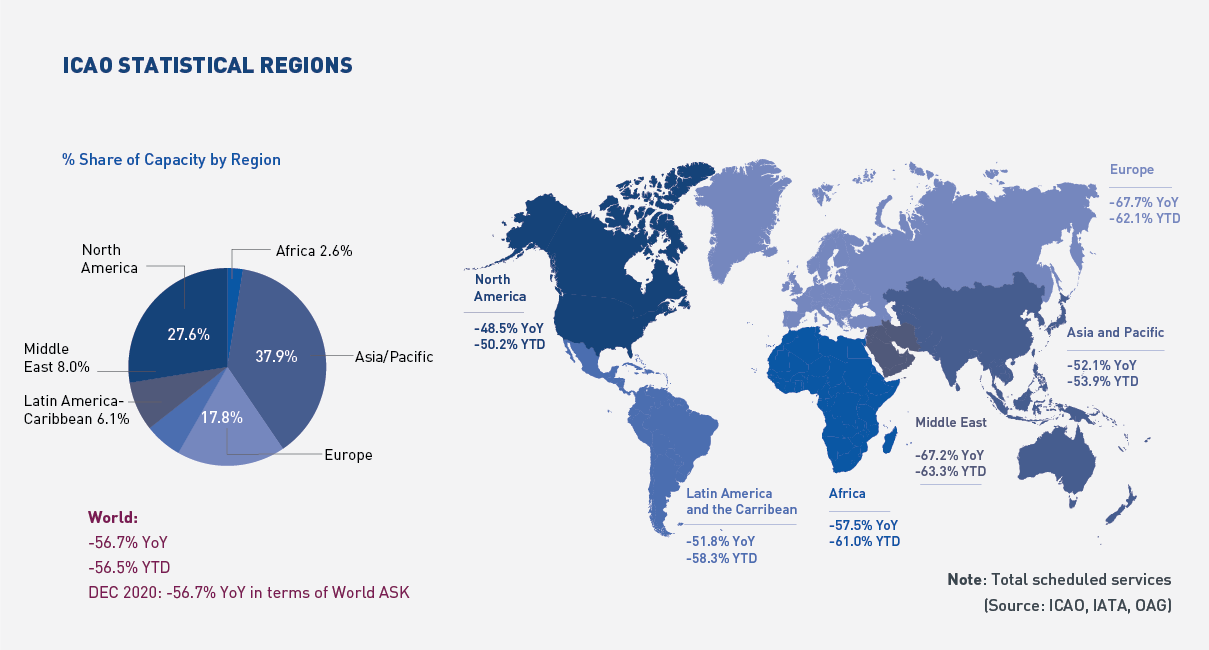
Worldwide capacity contracted by -56.7% YoY in December 2020. All regions saw increases in capacity, with the most significant acceleration in Africa, followed by Europe and Latin America/Caribbean. Capacity increase in other regions was modest.
Capacity offered in 2020 closed out at -56.5% YoY. The fastest resumption in capacity was recorded in North America while the slowest was seen in the Middle East.
Click here to download the Monthly Monitor January PDF version.
For any queries for further information, please contact the ICAO Economic Development (ECD), Air Transport Bureau ecd@icao.int
Acronyms: ACI: Airports Council International; ASK: Available Seat-Kilometres; IATA: International Air Transport Association; FTK: Freight Tonne-Kilometres; LF: Passenger Load Factor; OAG: Official Airline Guide; RPK: Revenue Passenger-Kilometres; UNWTO: World Tourism Organization; YoY: Year-on-year; YTD: Year-to-date.