The air transport industry is not only a vital engine of global socio-economic growth, but it is also of vital importance as a catalyst for economic development. Not only does the industry create direct and indirect employment and support tourism and local businesses, but it also stimulates foreign investment and international trade.
Informed decision-making is the foundation upon which successful businesses are built. In a fast-growing industry like aviation, planners and investors require the most comprehensive, up-to-date, and reliable data. ICAO’s aviation data/statistics programme provides accurate, reliable and consistent aviation data so that States, international organizations, aviation industry, tourism and other stakeholders can:
- make better projections;
- control costs and risks;
- improve business valuations; and
- benchmark performance.
The UN recognized ICAO as the central agency responsible for the collection, analysis, publication, standardization, improvement and dissemination of statistics pertaining to civil aviation. Because of its status as a UN specialized agency, ICAO remains independent from outside influences and is committed to consistently offering comprehensive and objective data. Every month ICAO produces this Air Transport Monitor, a monthly snapshot and analysis of the economic and aviation indicators.
ECONOMIC DEVELOPMENT – December 2020
World Results and Analyses for October 2020
Total Scheduled Services (Domestic and International)
Passenger traffic
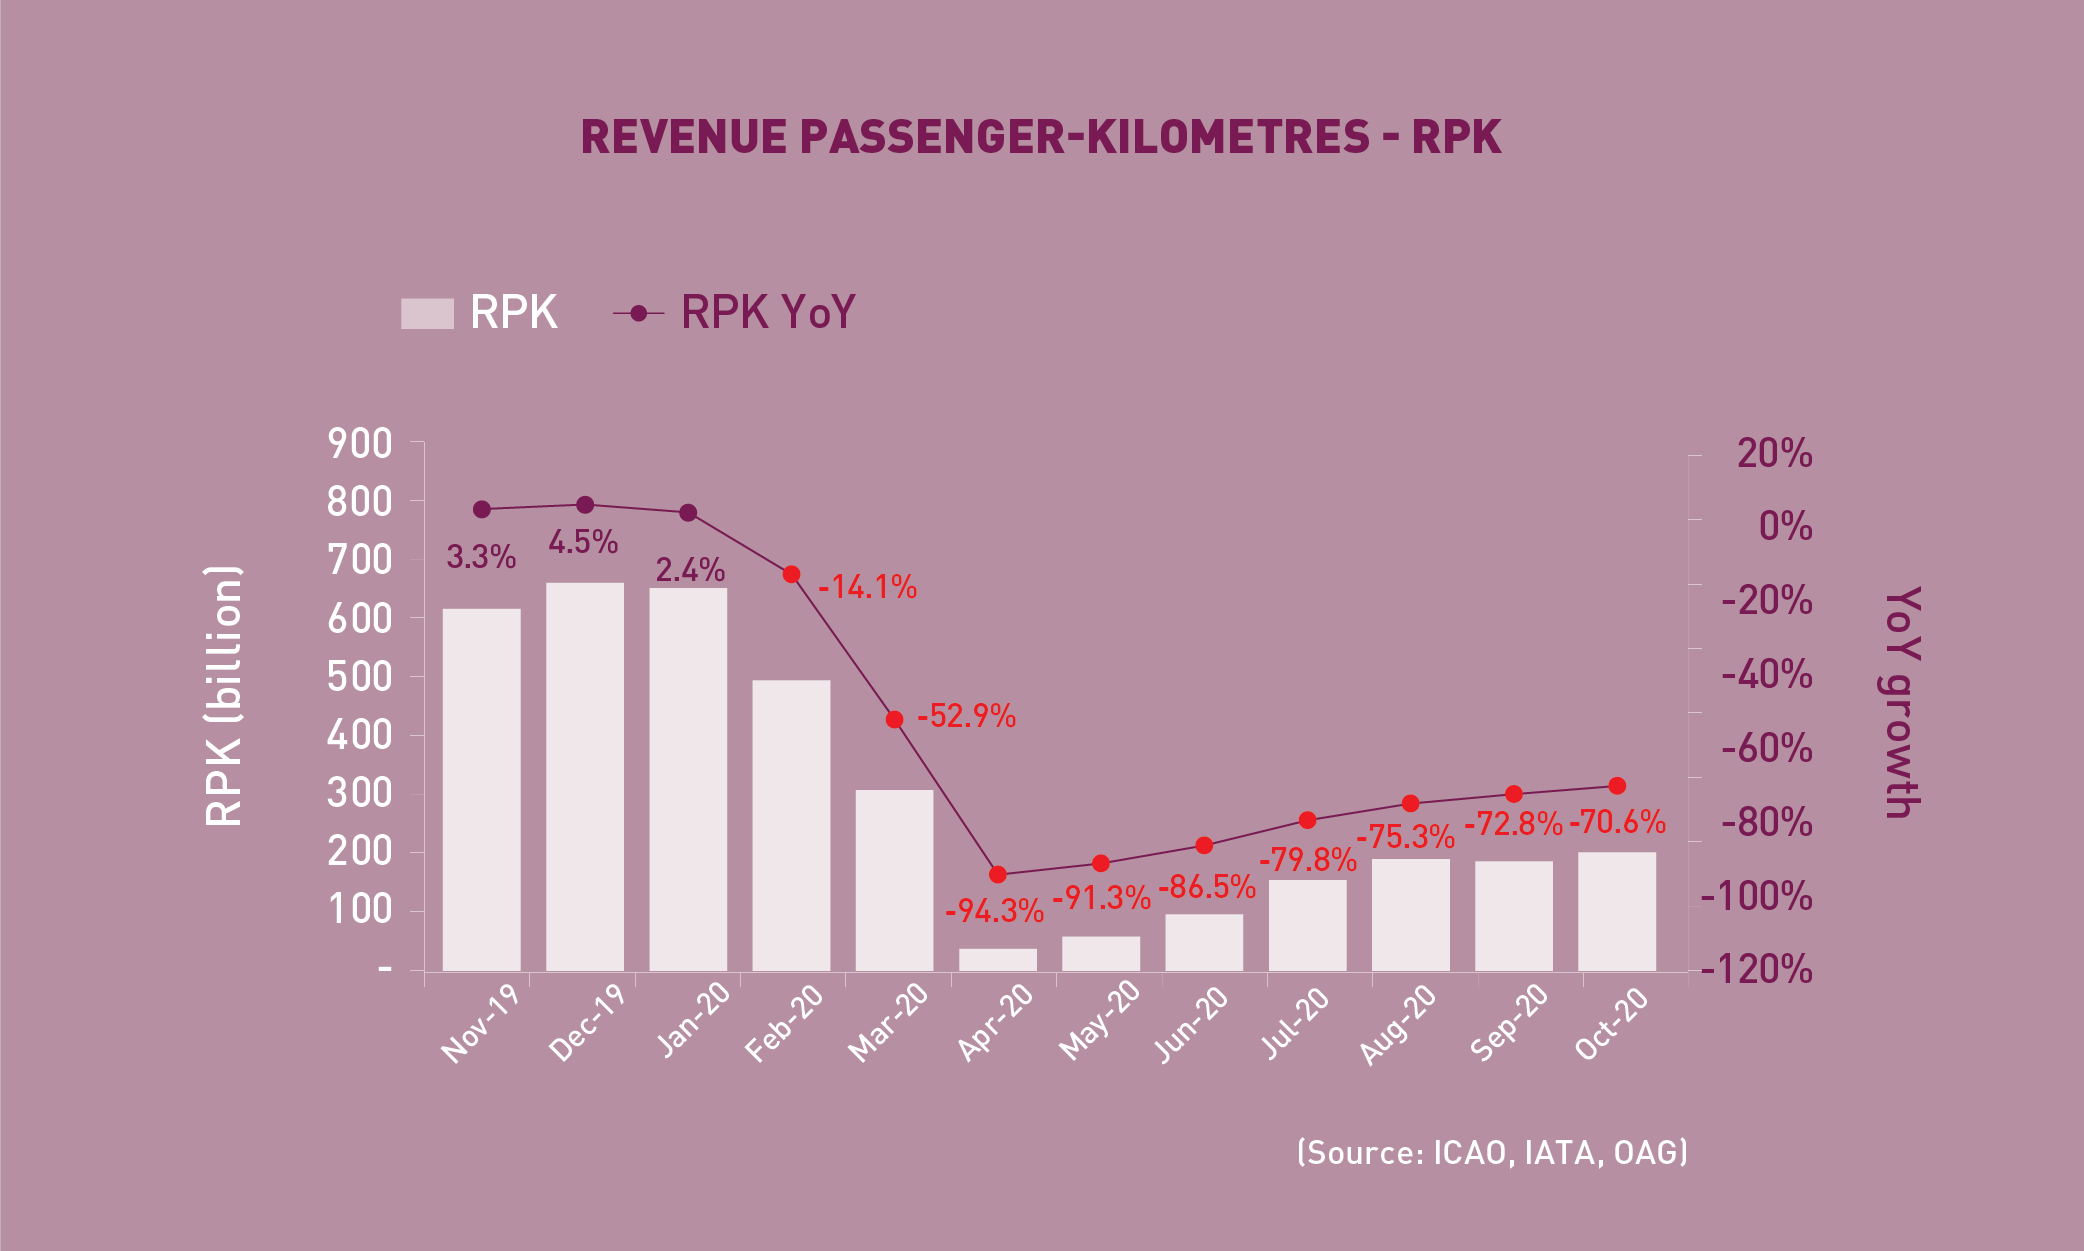
Revenue Passenger-Kilometres – RPK
World passenger traffic fell by -70.6% YoY in October 2020, +2.2 percentage points up from the decline in the previous month. The pace of recovery moderated further amid the resurgent epidemics and stricter containment measures. Europe was the main contributor to the moderation, being the only region with deteriorated traffic decline. On the contrary, Africa and Latin America/Caribbean have shown more resilience. Domestic travel in China demonstrated the best performance with traffic recovering to nearly pre-pandemic levels.
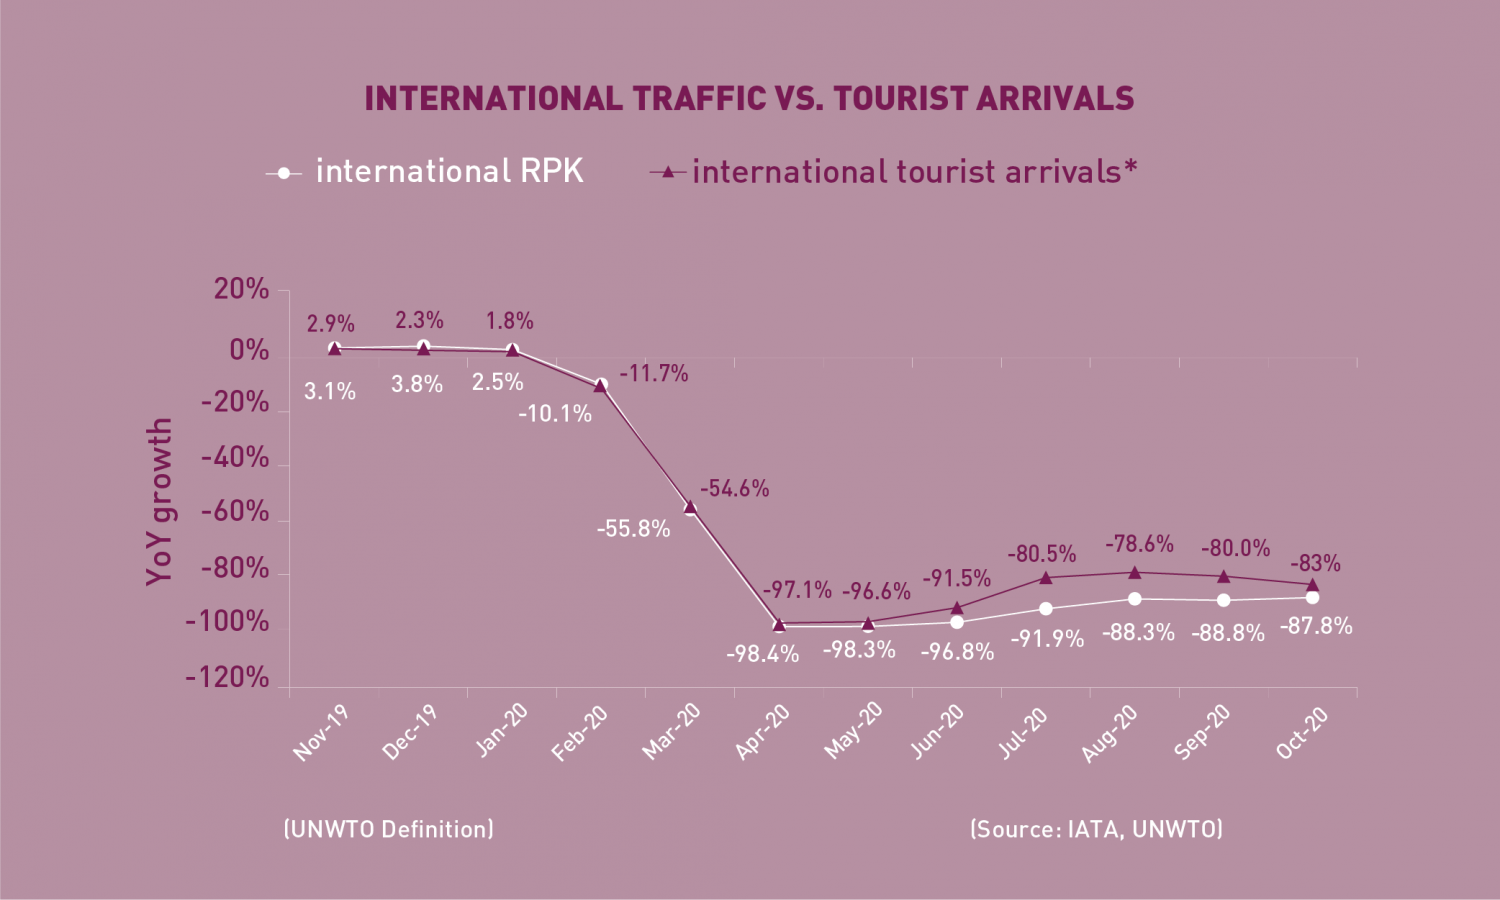
International Traffic vs. Tourist Arrivals
International passenger traffic fell by -87.8% YoY in October 2020, +1.0 percentage point up from the decline in the previous month. Improvements in international travel continued to be insignificant with subdued demand and ongoing cross-border travel restrictions across all regions.
The international tourist arrivals also remained stagnant and followed a similar trend as international passenger traffic.
Capacity
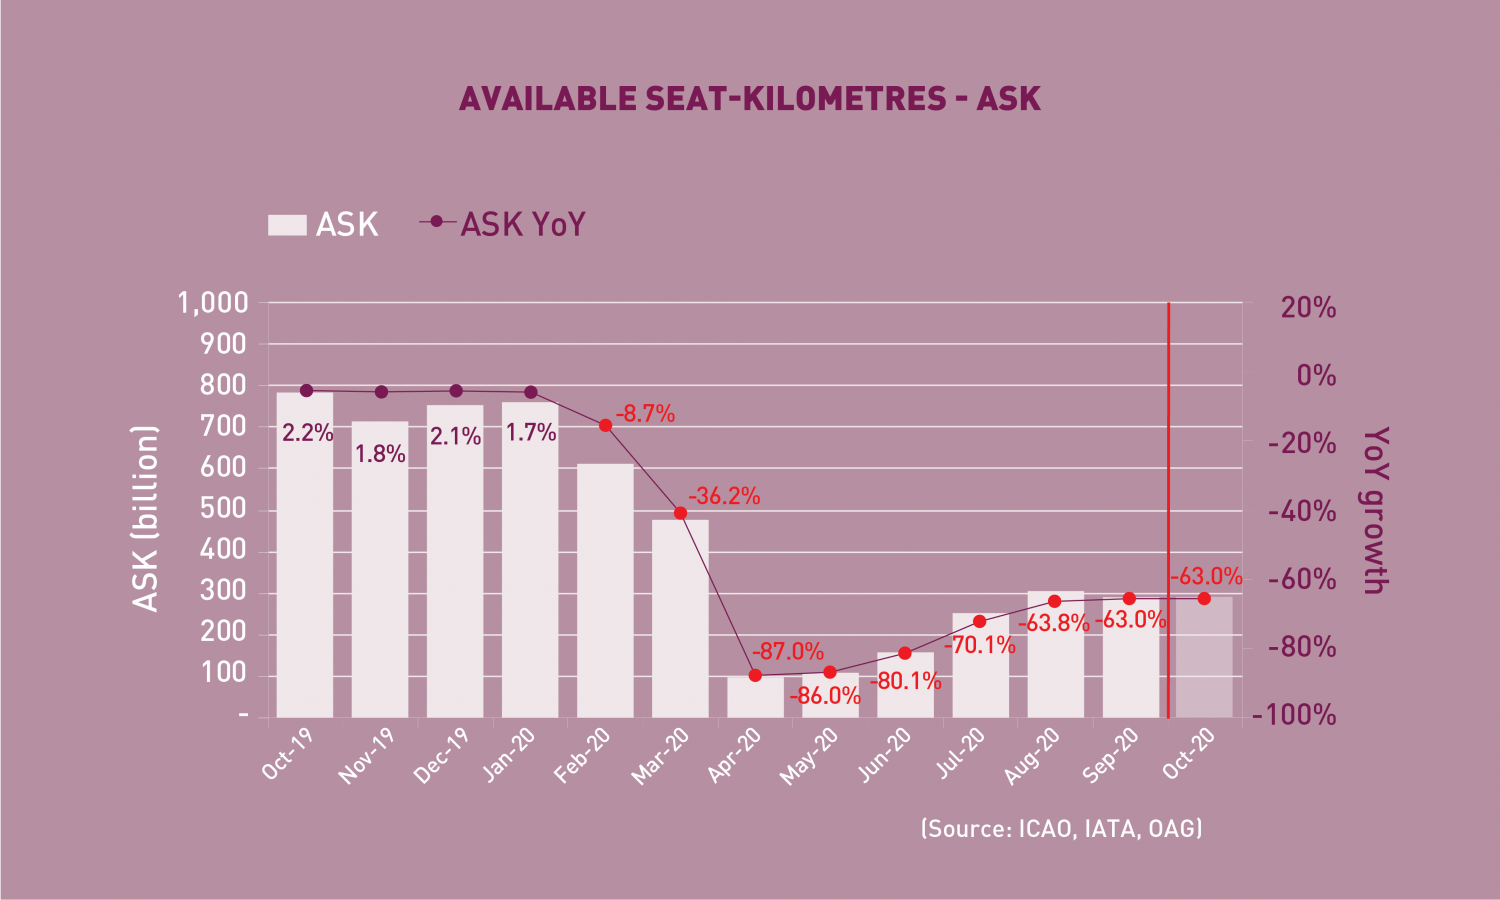
Available Seat-Kilometres – ASK
Capacity worldwide fell by -59.9% YoY in October 2020, +3.1 percentage points up from the decline in the previous month (-63.0%). In light of the renewed outbreaks, airlines’ resumption of operations is likely to slow down, and the contraction in world capacity in November is expected to be at -58.1% YoY.
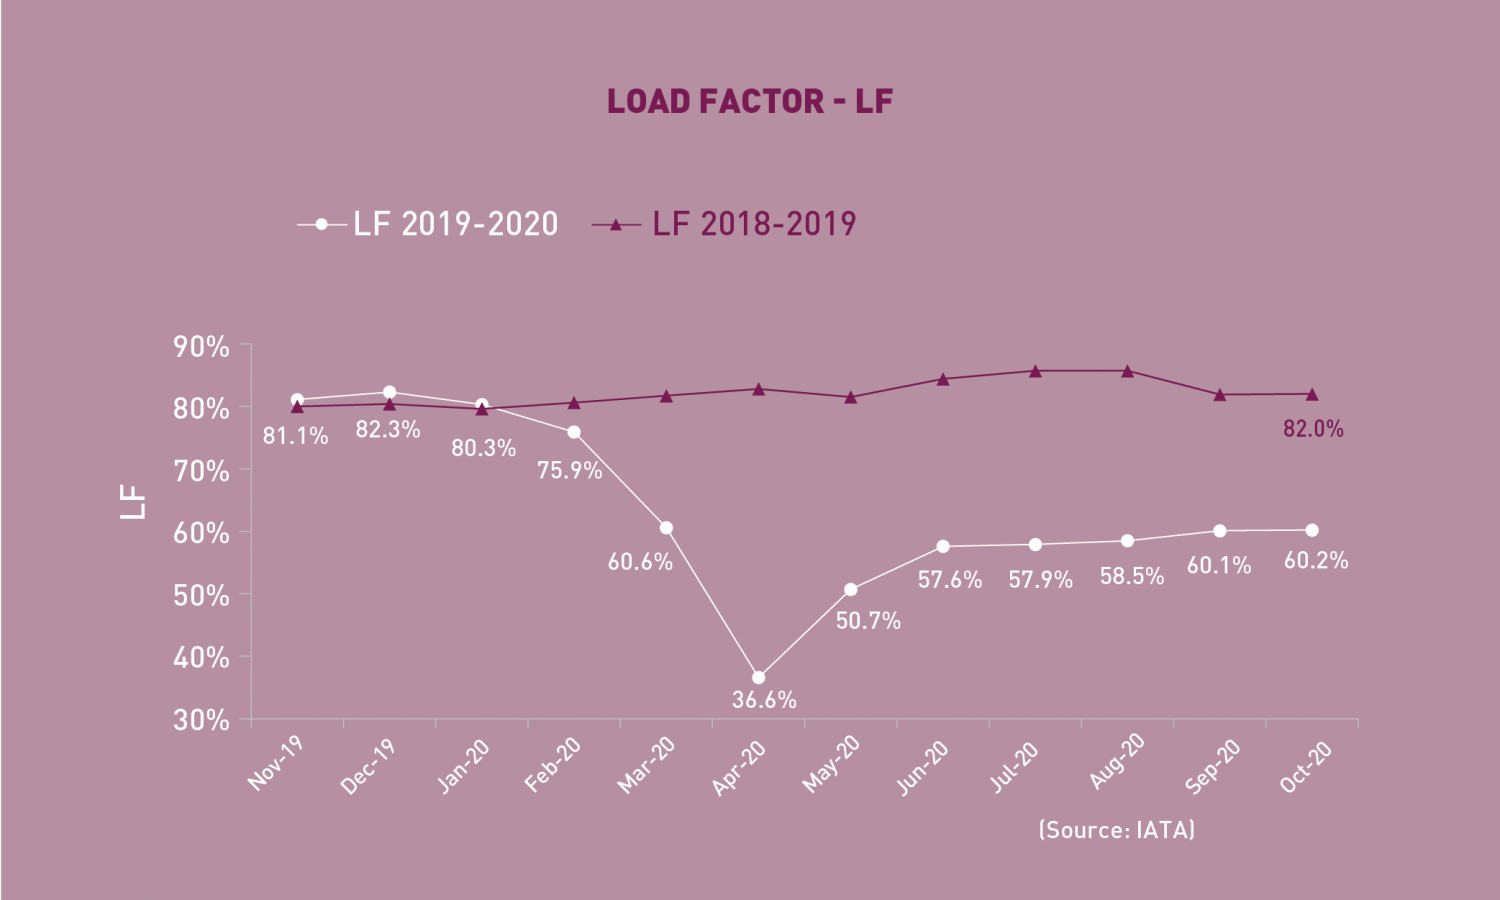
Load Factor
The passenger Load Factor reached 60.2% in October 2020, +0.1 percentage point higher than the previous month. As the fall in air travel demand was still deeper than capacity cut, the October LF was -21.8 percentage points lower than the rate in the same period of 2019.
Freight Traffic
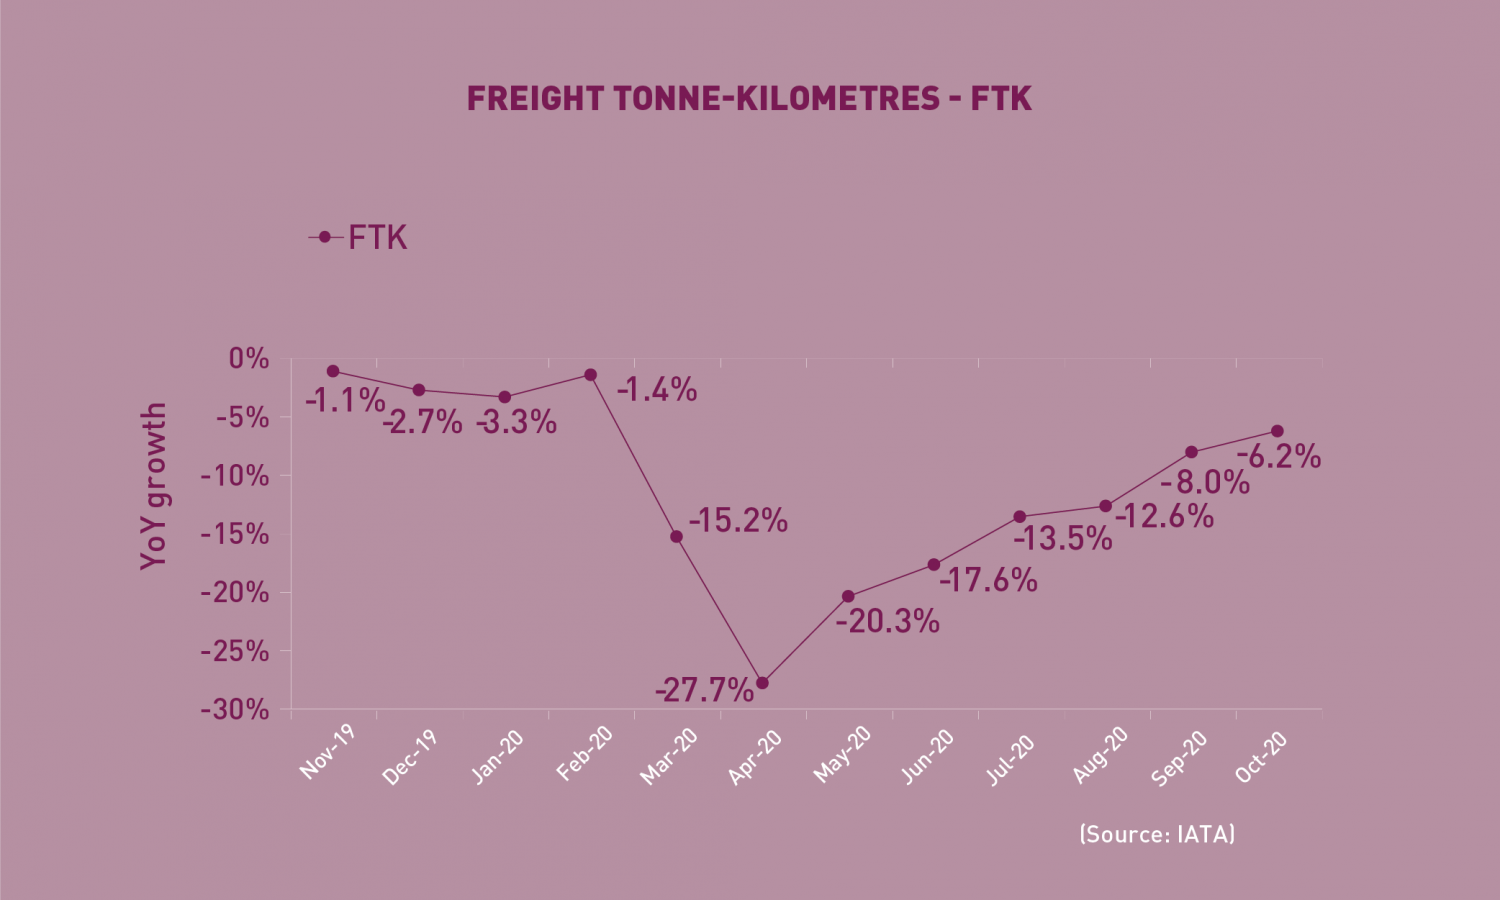
Freight Tonne-Kilometres – FTK
World freight traffic reported a decline of -6.2% YoY in October 2020, +1.8 percentage points up from the fall in the previous month. Demand in air cargo continued to recover significantly faster than air travel demand, despite at a slightly eased pace. The main cause of the overall moderation was the softening in North America and Africa, particularly in the latter. Nevertheless, the two regions remained as the strongest performing ones and have returned to pre-crisis levels since September. Moreover, the recovery in the Middle East stalled, affected by a weaker demand to/from Africa. Improvements were recorded by the remaining regions with a particularly brisk upswing in Latin America/Caribbean.
Top 15 Airports (Ranked by aircraft departures, passengers and volume of freight)
Note: Figures include total scheduled and non-scheduled services
October 2020: –28.1%, -36.9%, and +6.2% YoY in terms of aircraft departures, passengers and freight for the Top 15
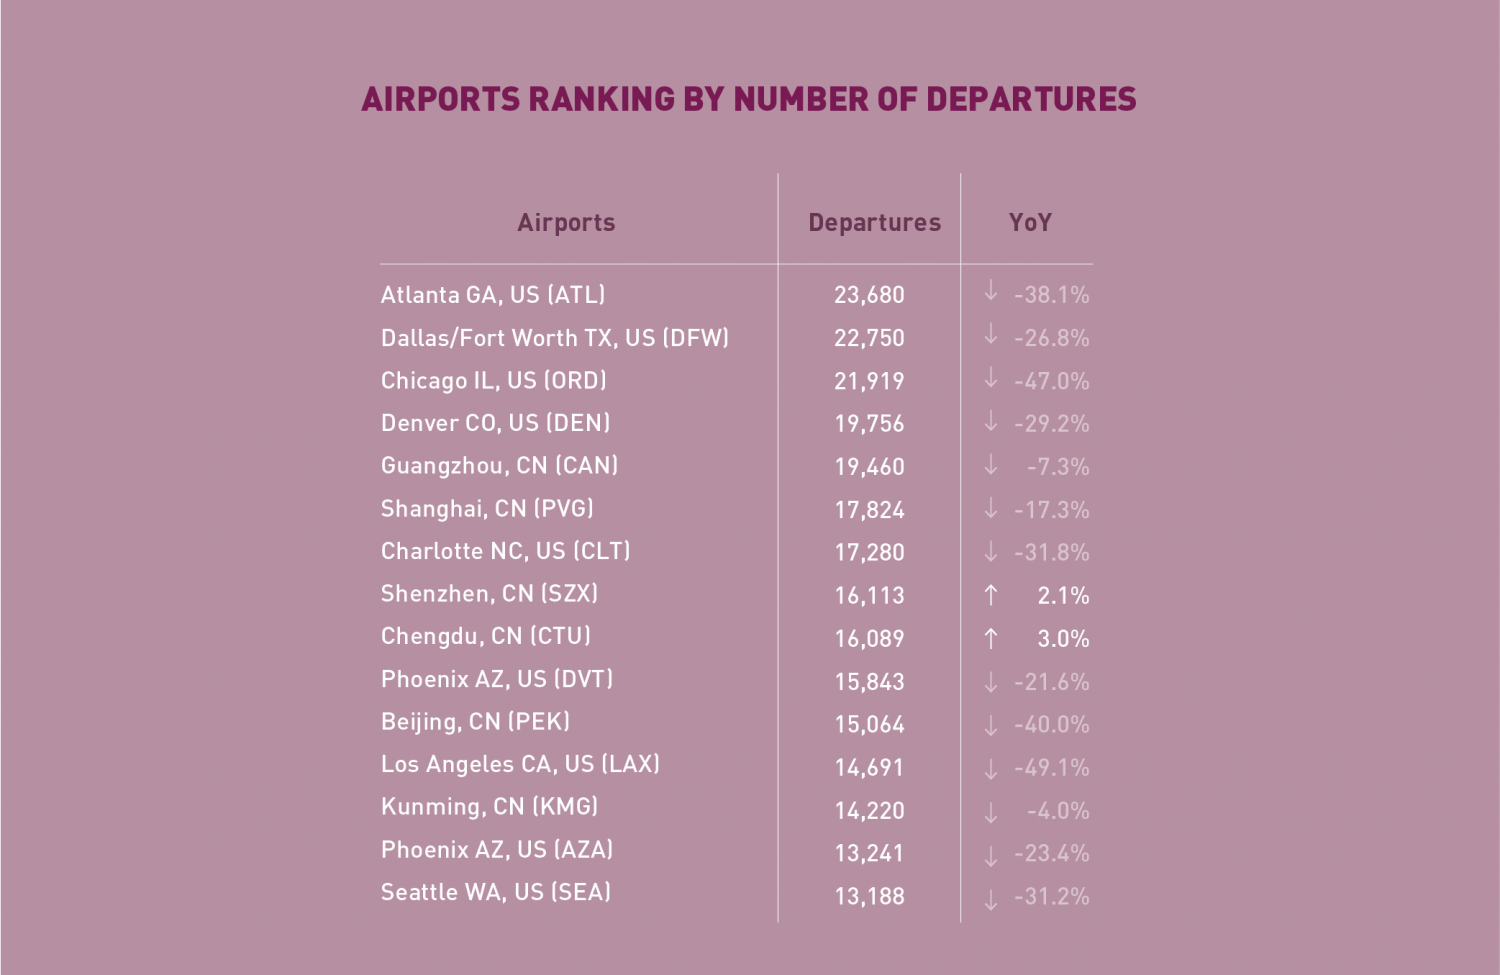
In terms of aircraft departures, the Top 15 airports reported a combined fall of -28.1% YoY. For the second consecutive month, positive growth was observed in the Top 15 with two airports in China, Shenzhen and Chengdu, increasing at +2.1% and +3.0%, respectively. Atlanta ranked 1st with -38.1% decline, followed by Chicago and Dallas/Fort Worth.
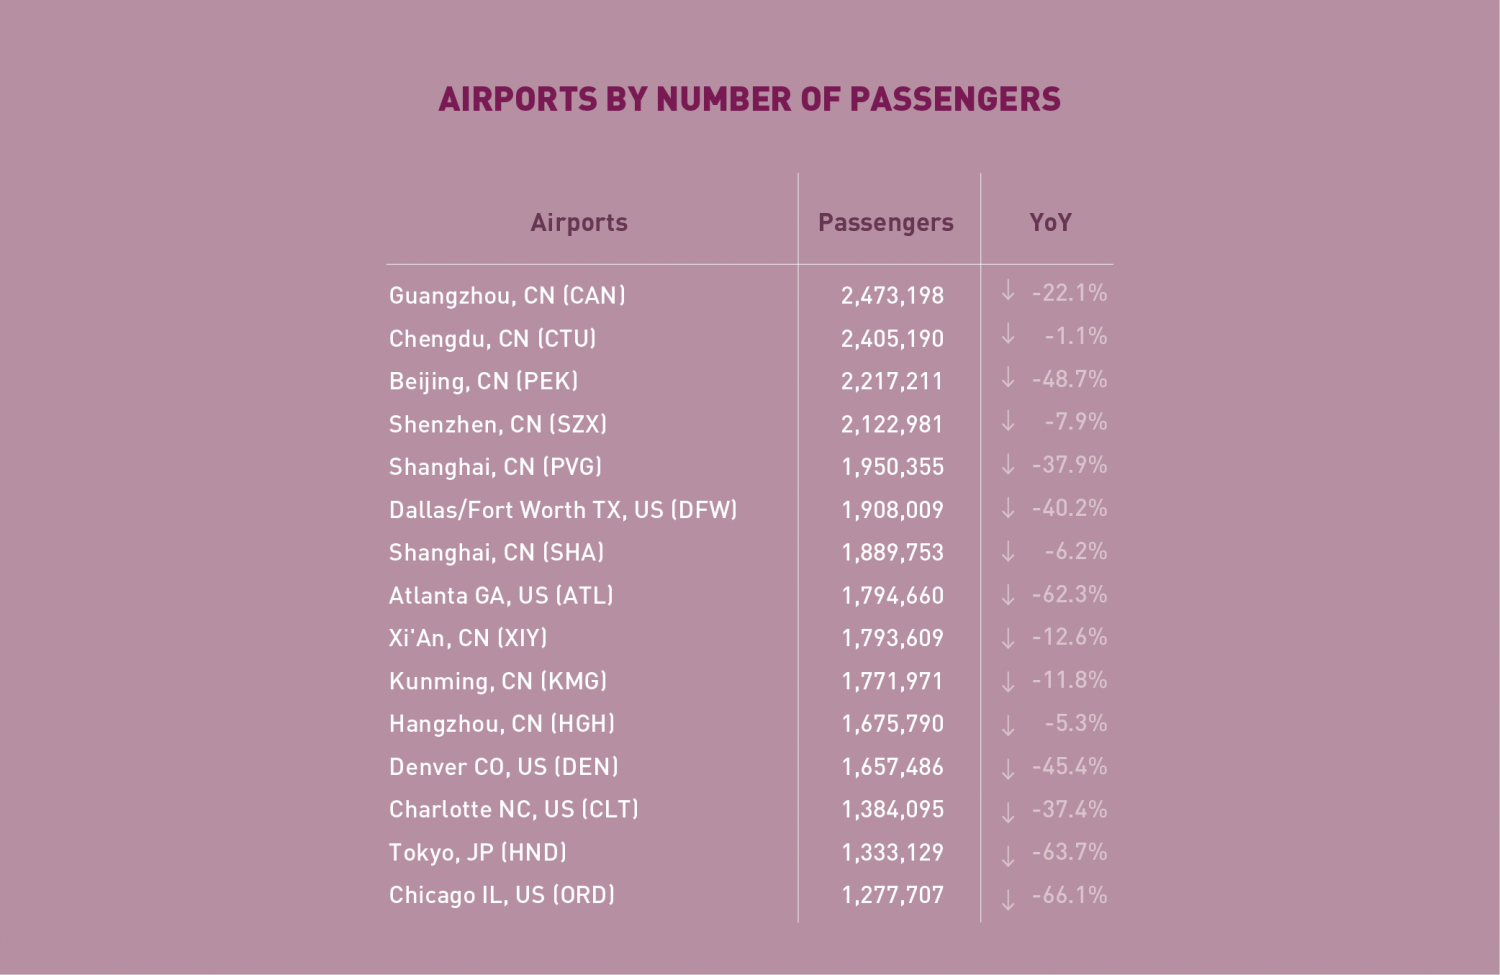
In terms of passengers, all the Top 15 airports posted a total fall of -36.9% YoY. Although YoY increase observed in the previous month disappeared, several Chinese airports have seen traffic returning closely to pre-crisis levels. Airports in China and US continue to dominate the Top 15 list with Guangzhou retaining the 1st place. Tokyo overtook Antalya and returned to the Top 15.
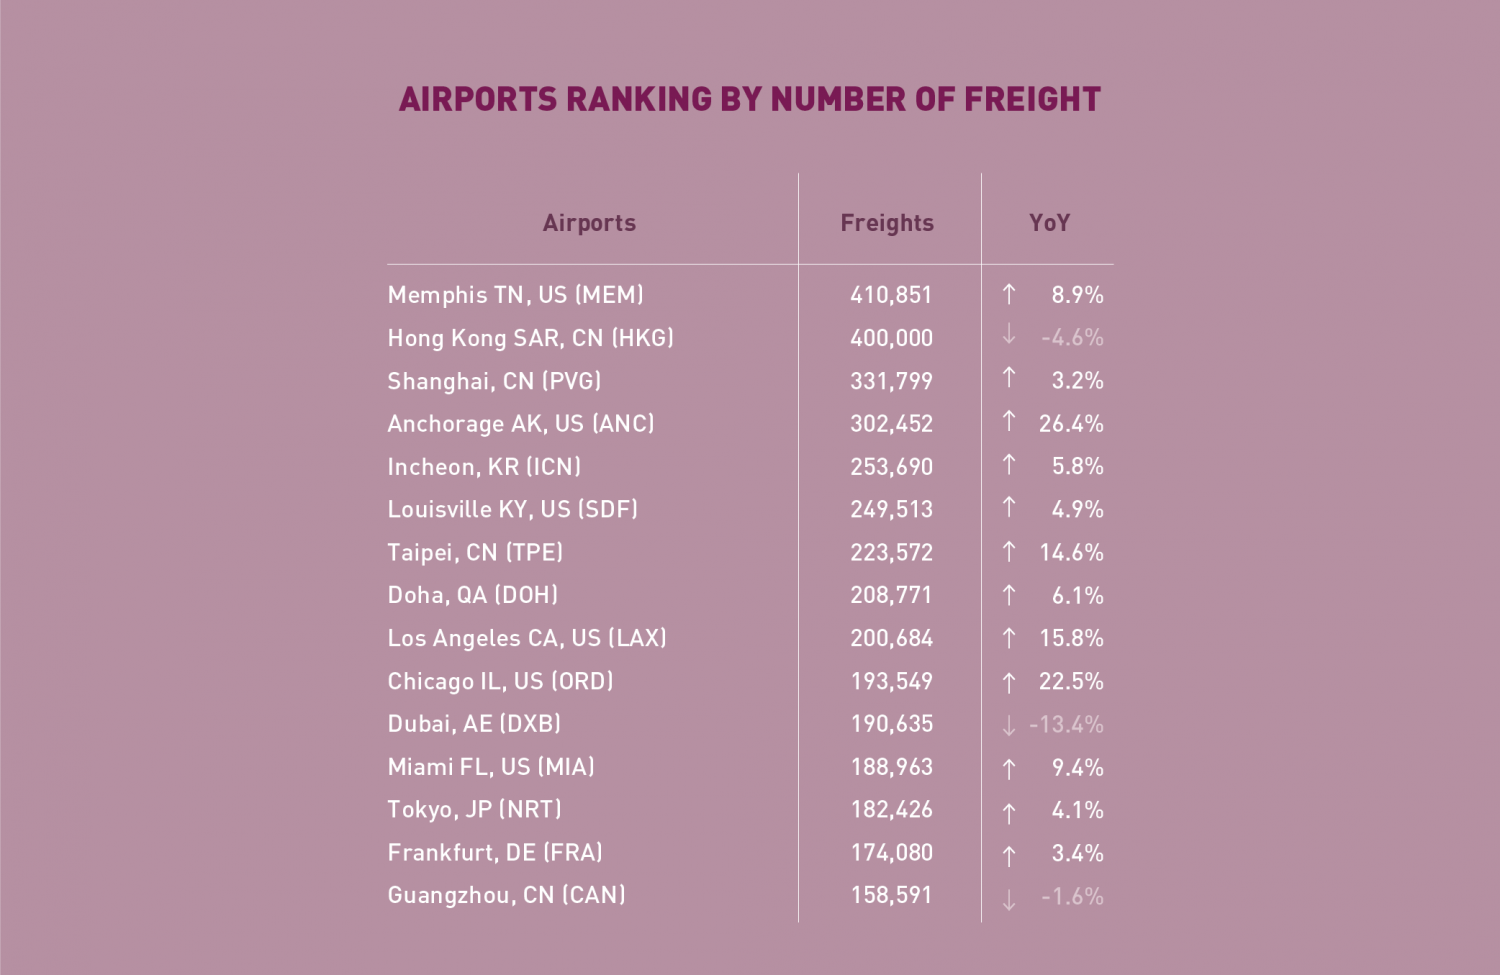
In terms of freight, the Top 15 airports reported a YoY increase of +6.2%. This was the fifth consecutive growth since June with majority of the Top 15 posting YoY increase. The strongest expansion was recorded by Anchorage (+26.4%) and Chicago (+22.5%). Three airports, Hong Kong, Dubai and Guangzhou were the only ones posting declines.
Top 15 Airline Groups (Ranked by RPK)
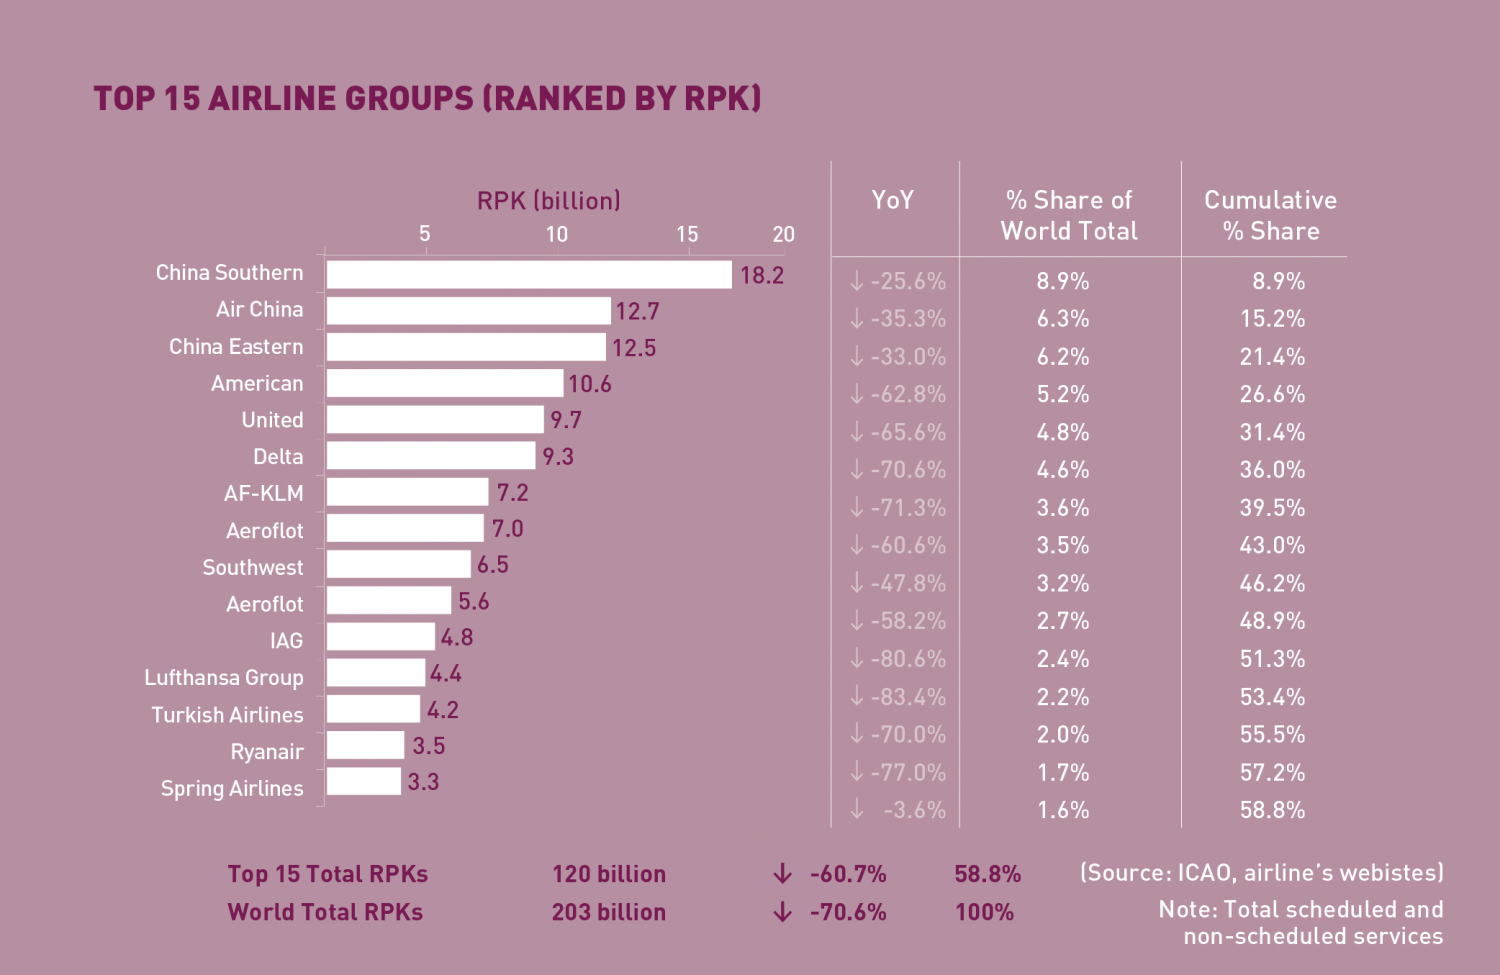
October 2020: –60.7% YoY in terms of RPK for the Top 15
In terms of RPK, the Top 15 airline groups accounted for 58.8% of the world’s total RPK in October 2020 and declined by –60.7% YoY. This decline was 9.9 percentage points smaller than the fall in world’s average RPK, with all airlines in the Top 15 posting contractions.
Same airlines as in the previous month claimed the Top 15 albeit with diverging recovery pace. All in all, airlines with larger domestic markets appeared to be more resilient.
Chinese airlines continued to lead the chart and posted considerably smaller declines. China Southern, Air China, and China Eastern maintained the Top 3 with traffic returning to over 60% of 2019 levels. Two other airlines, Hainan Airlines and Spring Airlines, ranked at 9th and 15th, respectively; and the latter also recorded the fastest recovery among the Top 15 with a moderate decline of -3.6%.
Following the Top 3 Chinese airlines were the three major US airlines, i.e. American, United and Delta whose traffic declined ranging from -60 to -70%. Southwest improved two positions to 8th with a slightly faster recovery among the US airlines.
Marginal improvements were recorded by airlines in Europe, nevertheless, AF-KLM climbed up two positions to 7th outperforming other airlines in the region. In contrast, both Aeroflot and Ryanair were down two positions respectively to 10th and 14th, posting deteriorated declines, particularly for Aeroflot due to the slowdown in domestic traffic recovery.
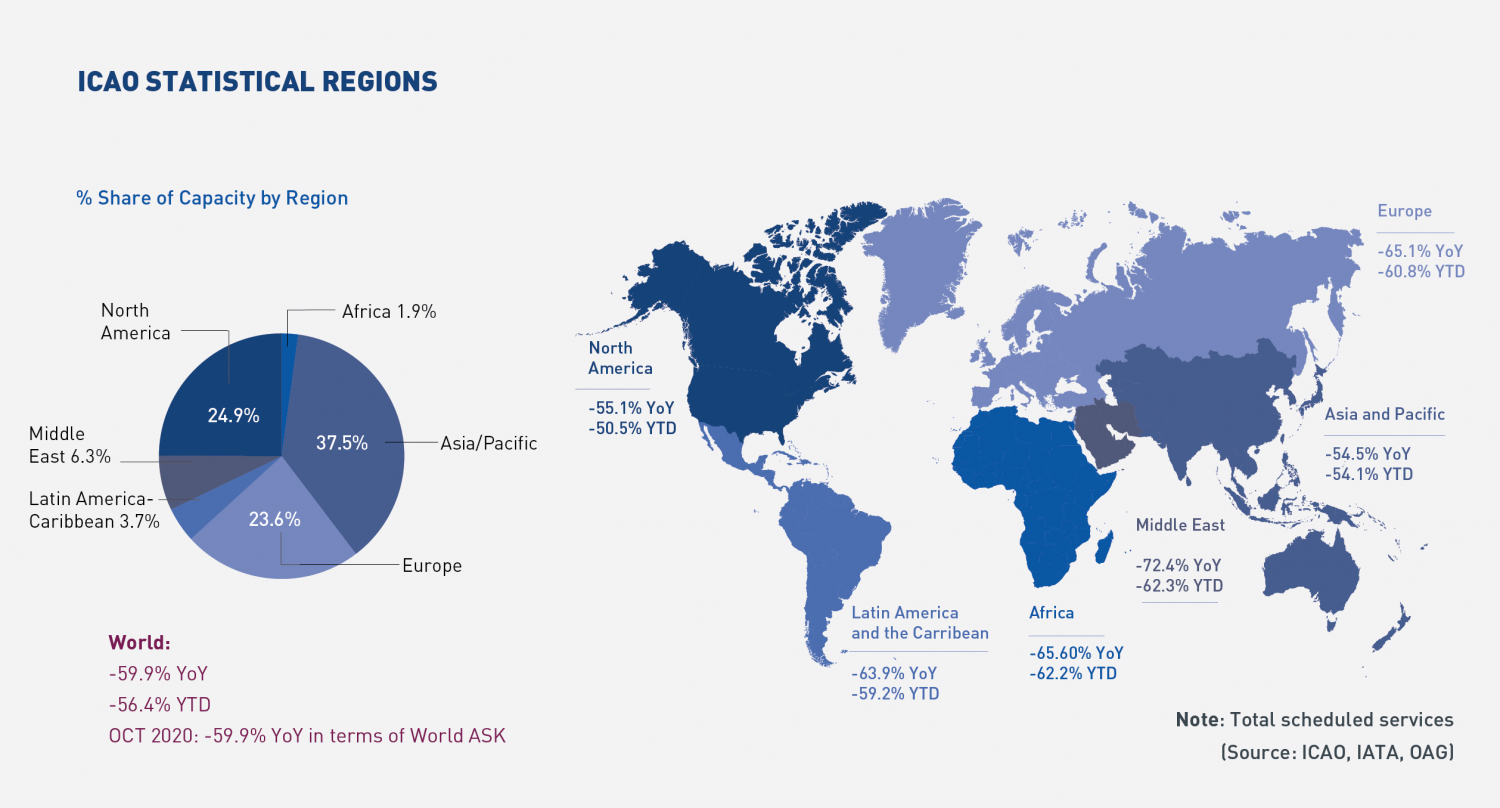
Worldwide capacity contracted by -59.9% YoY in October 2020. Capacity were added in all regions with the exception in Europe which has seen further cut in response to the spike in COVID-19 cases and more restricted cross-border travel. North America and Asia/Pacific showed the fastest recovery in capacity, while Latin America/Caribbean and Africa recorded the biggest
Click here to download the Monthly Monitor December PDF version.
For any queries for further information, please contact the ICAO Economic Development (ECD), Air Transport Bureau ecd@icao.int
Acronyms: ACI: Airports Council International; ASK: Available Seat-Kilometres; IATA: International Air Transport Association; FTK: Freight Tonne-Kilometres; LF: Passenger Load Factor; OAG: Official Airline Guide; RPK: Revenue Passenger-Kilometres; UNWTO: World Tourism Organization; YoY: Year-on-year; YTD: Year-to-date.