The air transport industry is not only a vital engine of global socio-economic growth, but it is also of vital importance as a catalyst for economic development. Not only does the industry create direct and indirect employment and support tourism and local businesses, but it also stimulates foreign investment and international trade.
Informed decision-making is the foundation upon which successful businesses are built. In a fast-growing industry like aviation, planners and investors require the most comprehensive, up-to-date, and reliable data. ICAO’s aviation data/statistics programme provides accurate, reliable and consistent aviation data so that States, international organizations, the aviation industry, tourism and other stakeholders can:
- make better projections;
- control costs and risks;
- improve business valuations; and
- benchmark performance.
The UN recognized ICAO as the central agency responsible for the collection, analysis, publication, standardization, improvement, and dissemination of statistics pertaining to civil aviation. Because of its status as a UN specialized agency, ICAO remains independent from outside influences and is committed to consistently offering comprehensive and objective data. Every month ICAO produces this Air Transport Monitor, a monthly snapshot and analysis of the economic and aviation indicators.
ECONOMIC DEVELOPMENT – August 2022
World Results and Analyses for June 2022
Total Scheduled Services (Domestic and International)
Passenger traffic
![]() Revenue Passenger-Kilometres – RPK
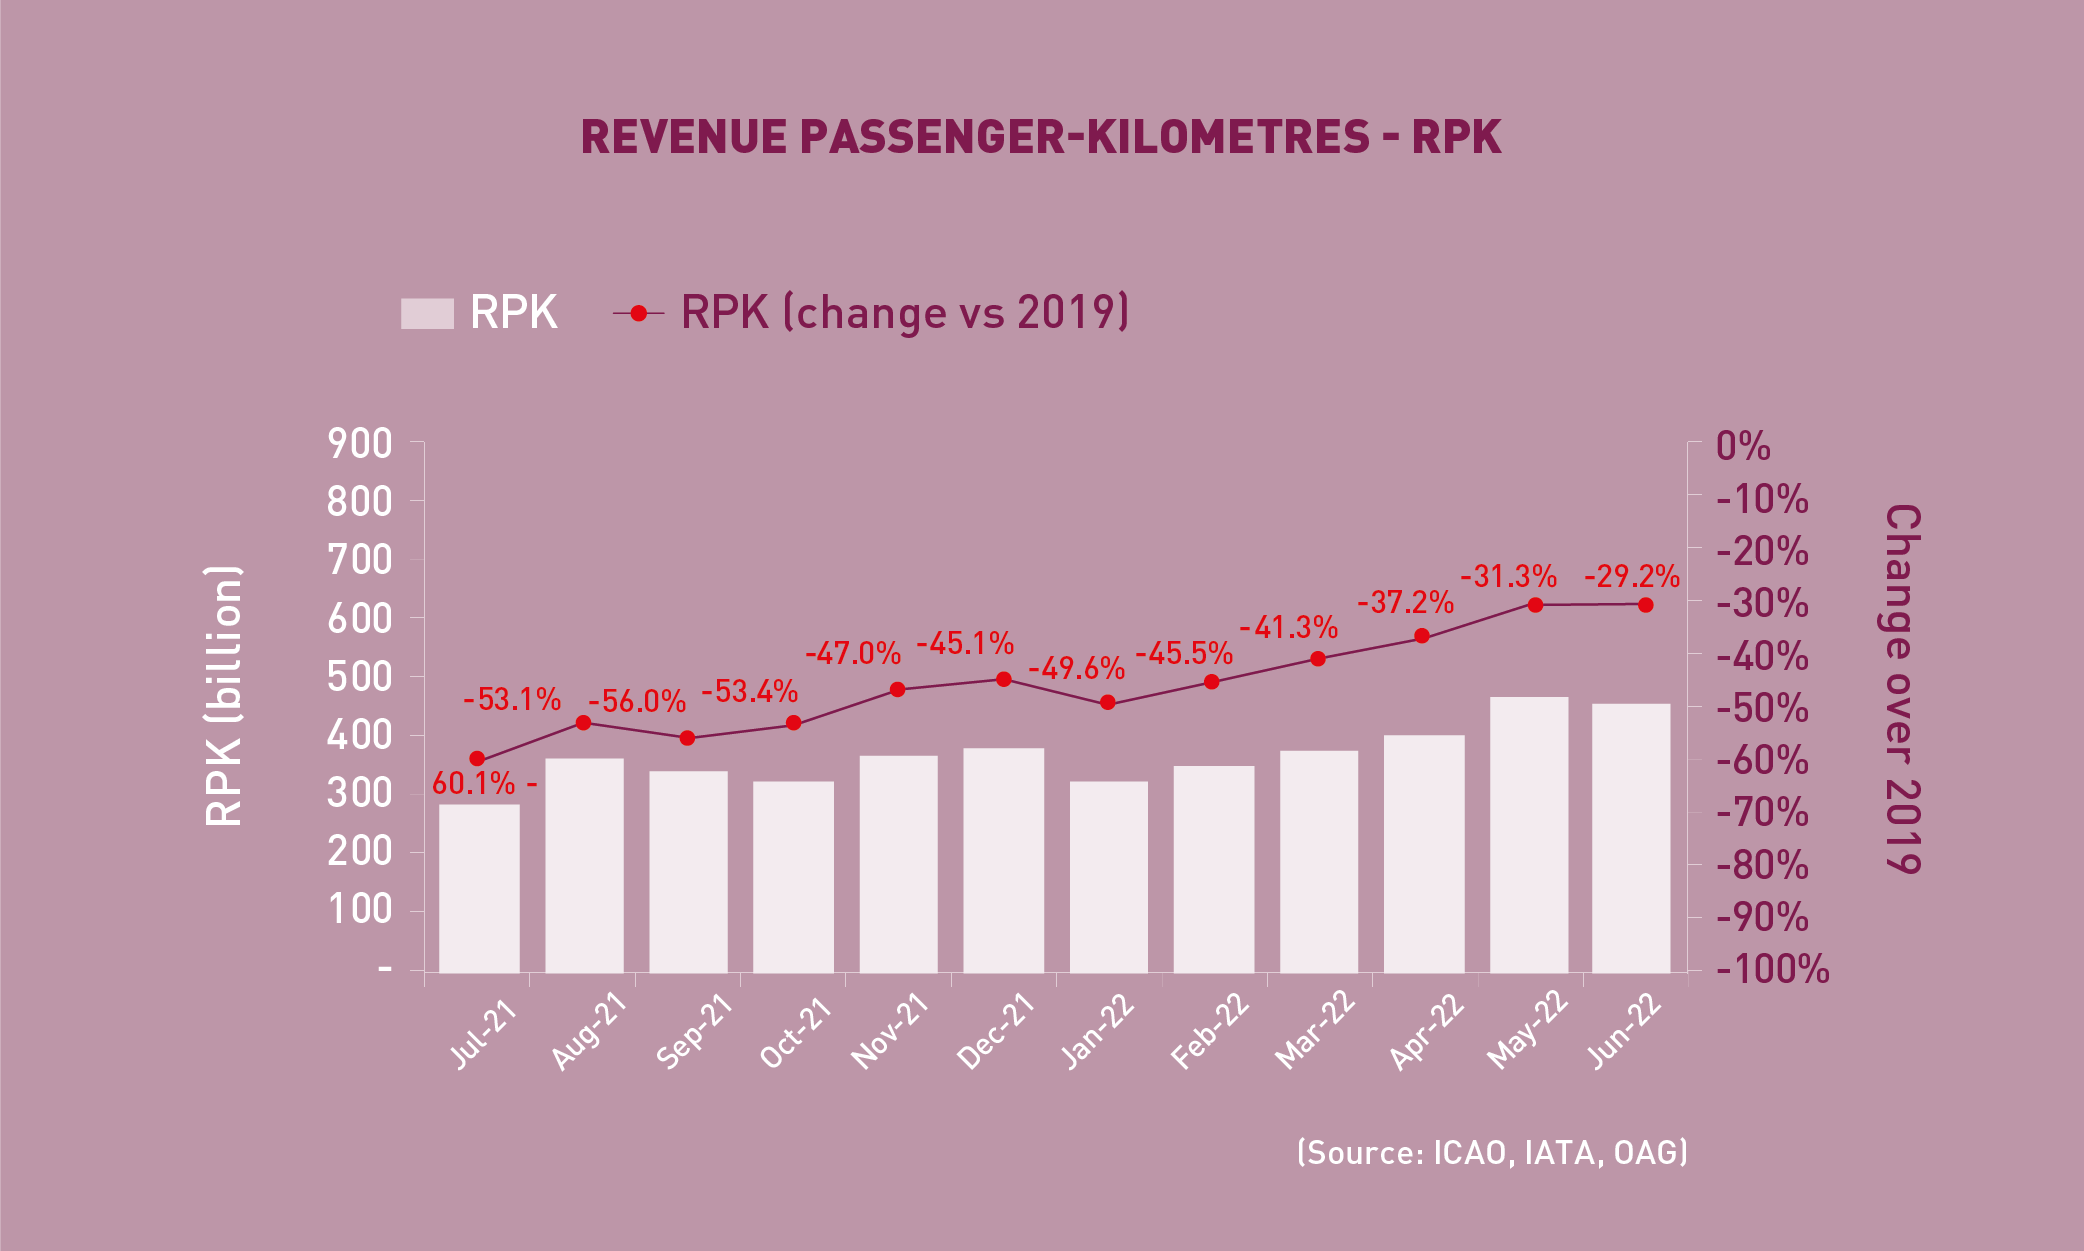
Revenue Passenger-Kilometres – RPK
 Revenue Passenger-Kilometres – RPK
World passenger traffic in June 2022 was -29.2% below the 2019 level, +2.1 percentage points up from the decline in the previous month. Despite the high fuel prices and inflation, the lifting of COVID-19 curbs and pent-up travel demand continued to drive the recovery of air travel. After trending sideways for several months, domestic travel started to rebound, particularly in Asia/Pacific. The region became the main contributor to the improvement, owing to the surge in domestic traffic in China alongside the gradual ease of lockdowns and travel restrictions.
![]() International Traffic vs. Tourist Arrivals
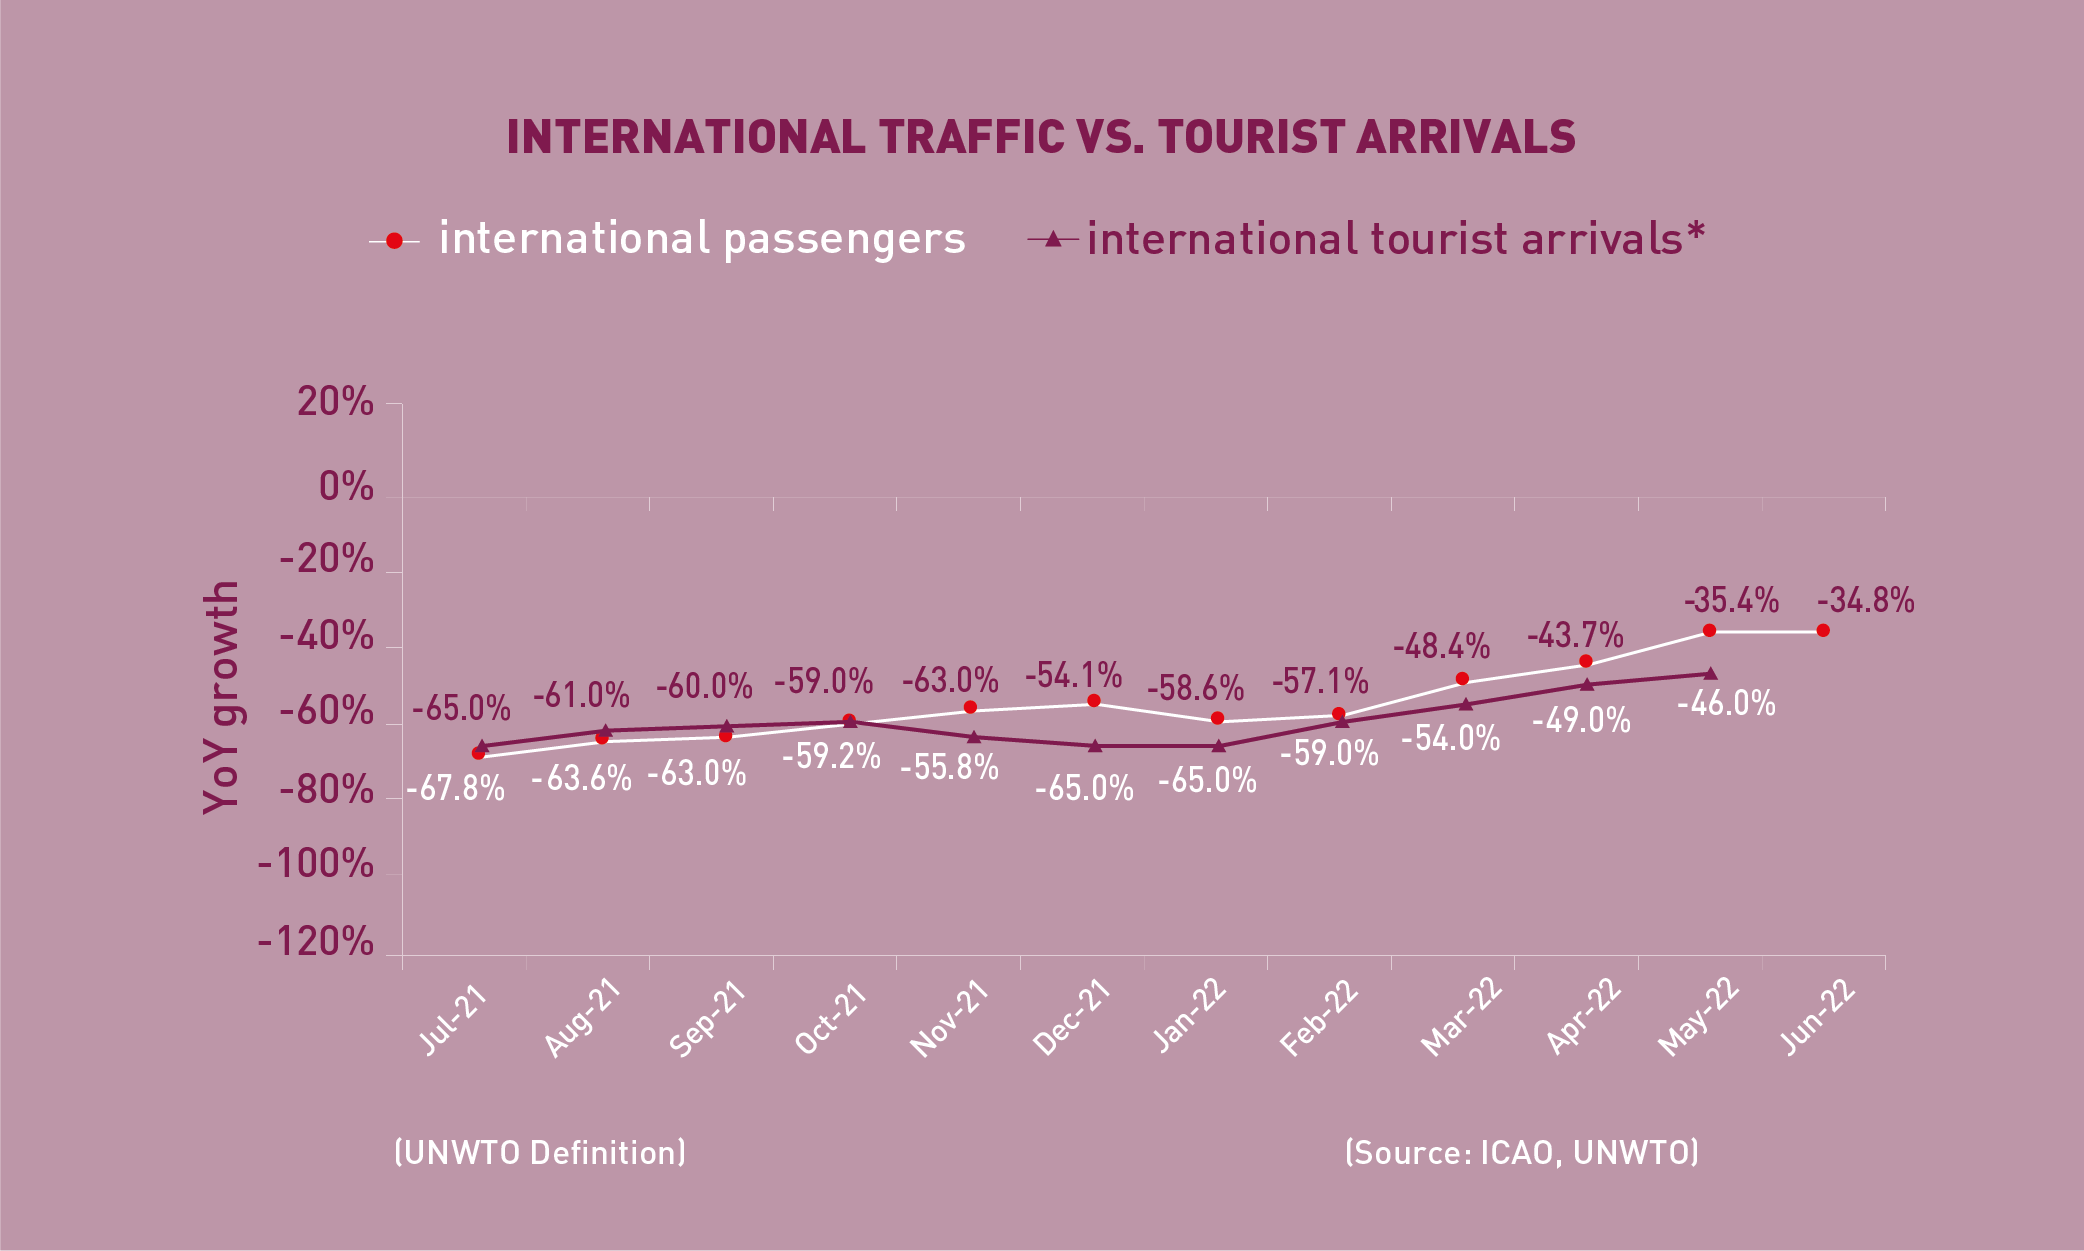
International Traffic vs. Tourist Arrivals
 International Traffic vs. Tourist Arrivals
International passenger numbers in June 2022 were -34.8% below the 2019 level, +0.6 percentage points up from the decline in the previous month. All regions saw significant month-on-month improvements in international air travel. The recovery in Asia/Pacific picked up sharply and recorded the strongest increase over the previous month. The recovery in international tourist arrivals followed a similar trend as international passenger traffic.
Capacity
![]() Available Seat-Kilometres – ASK
Available Seat-Kilometres – ASK
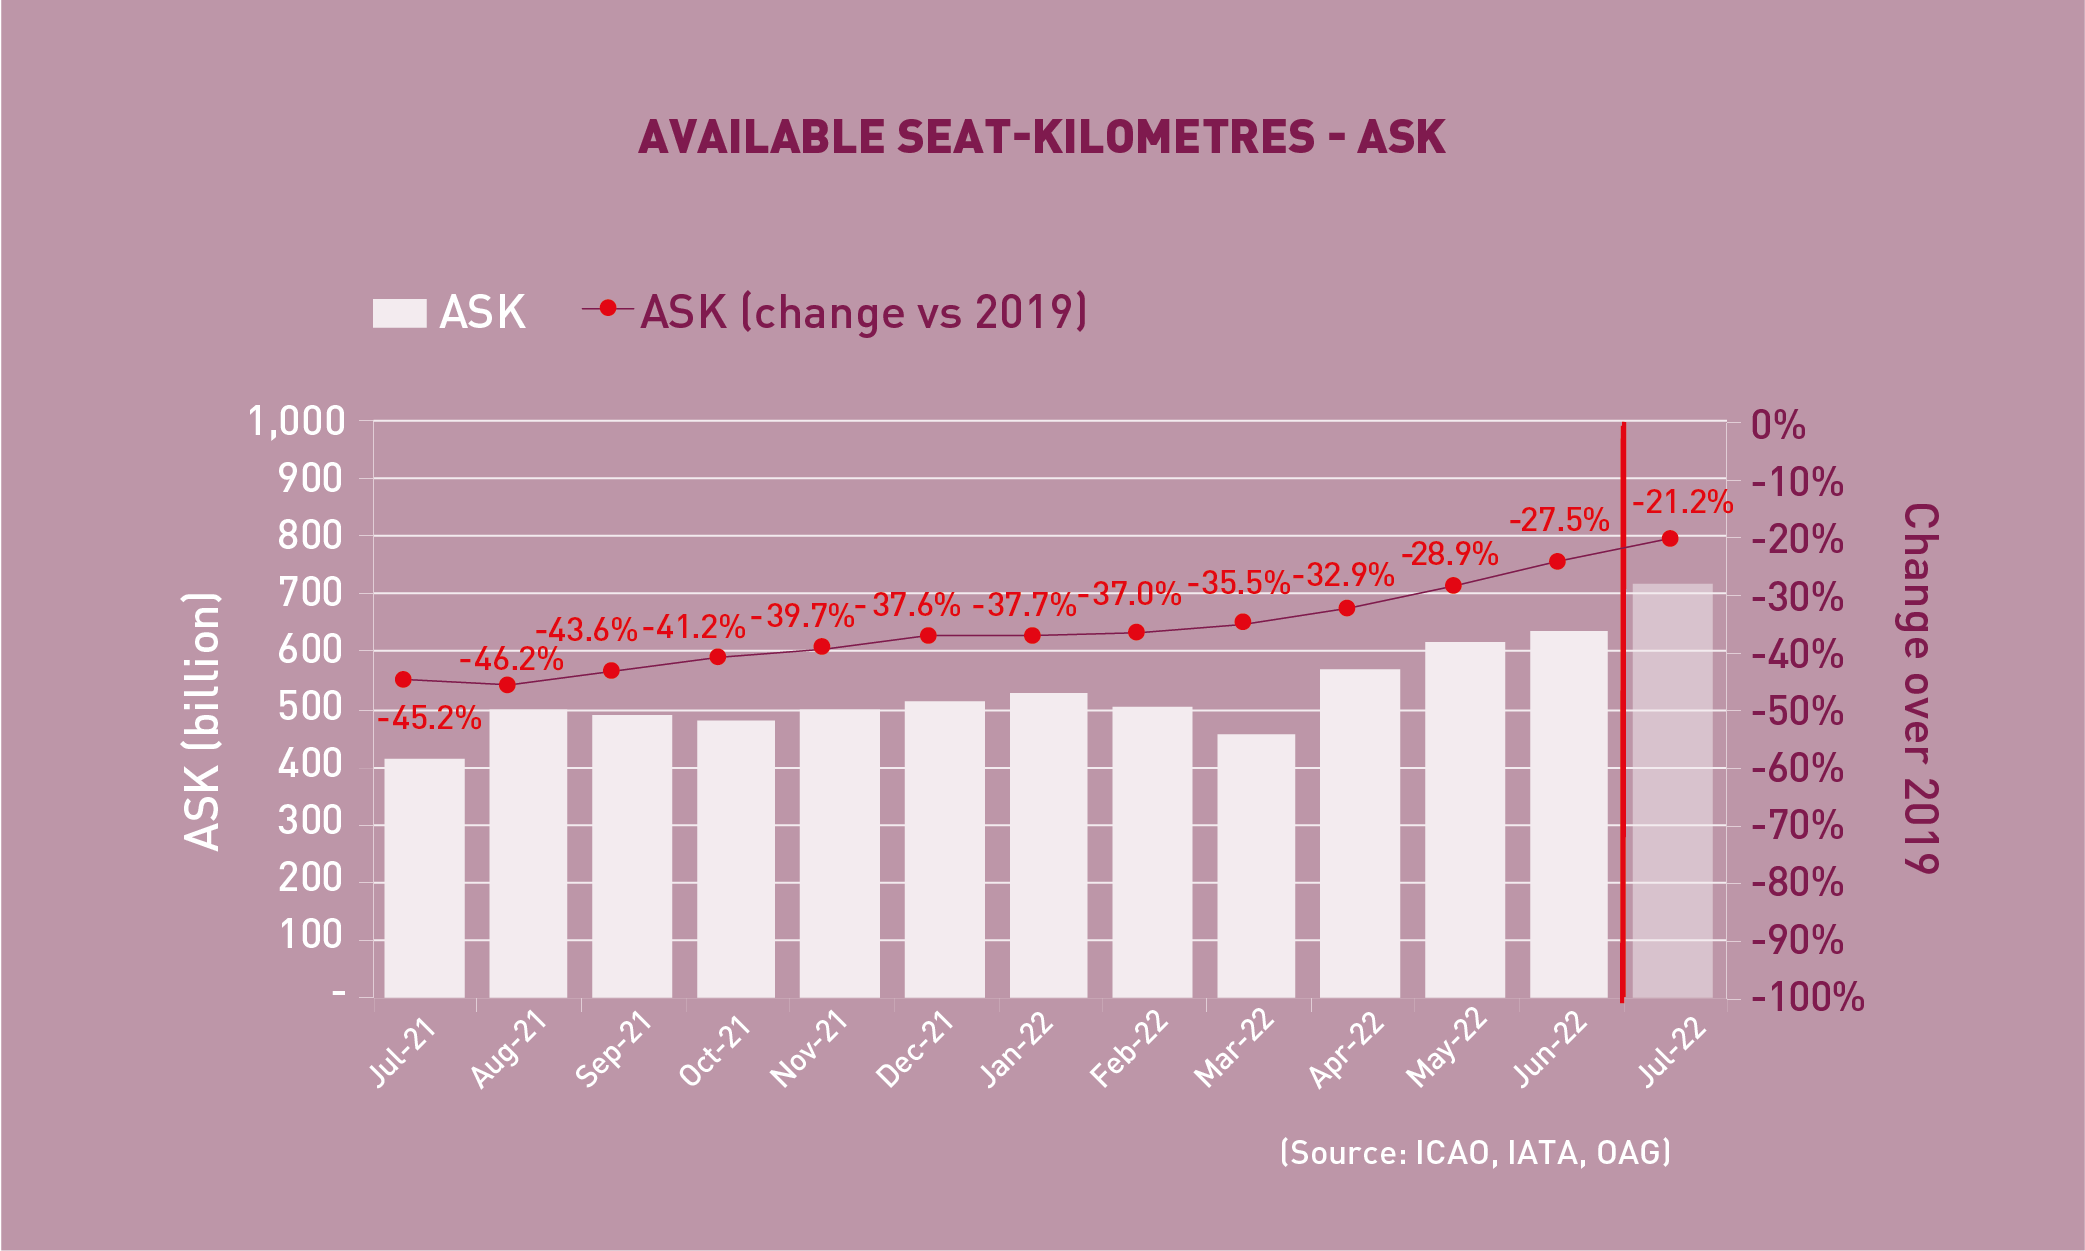 Available Seat-Kilometres – ASK
Capacity worldwide in June 2022 was -27.5% below the 2019 level, +1.4 percentage points up from the decline in the previous month (-28.9%). As air travel recovery continues, capacity offered in July is expected to improve to -21.2% down from the 2019 level.
![]() Load Factor
Load Factor
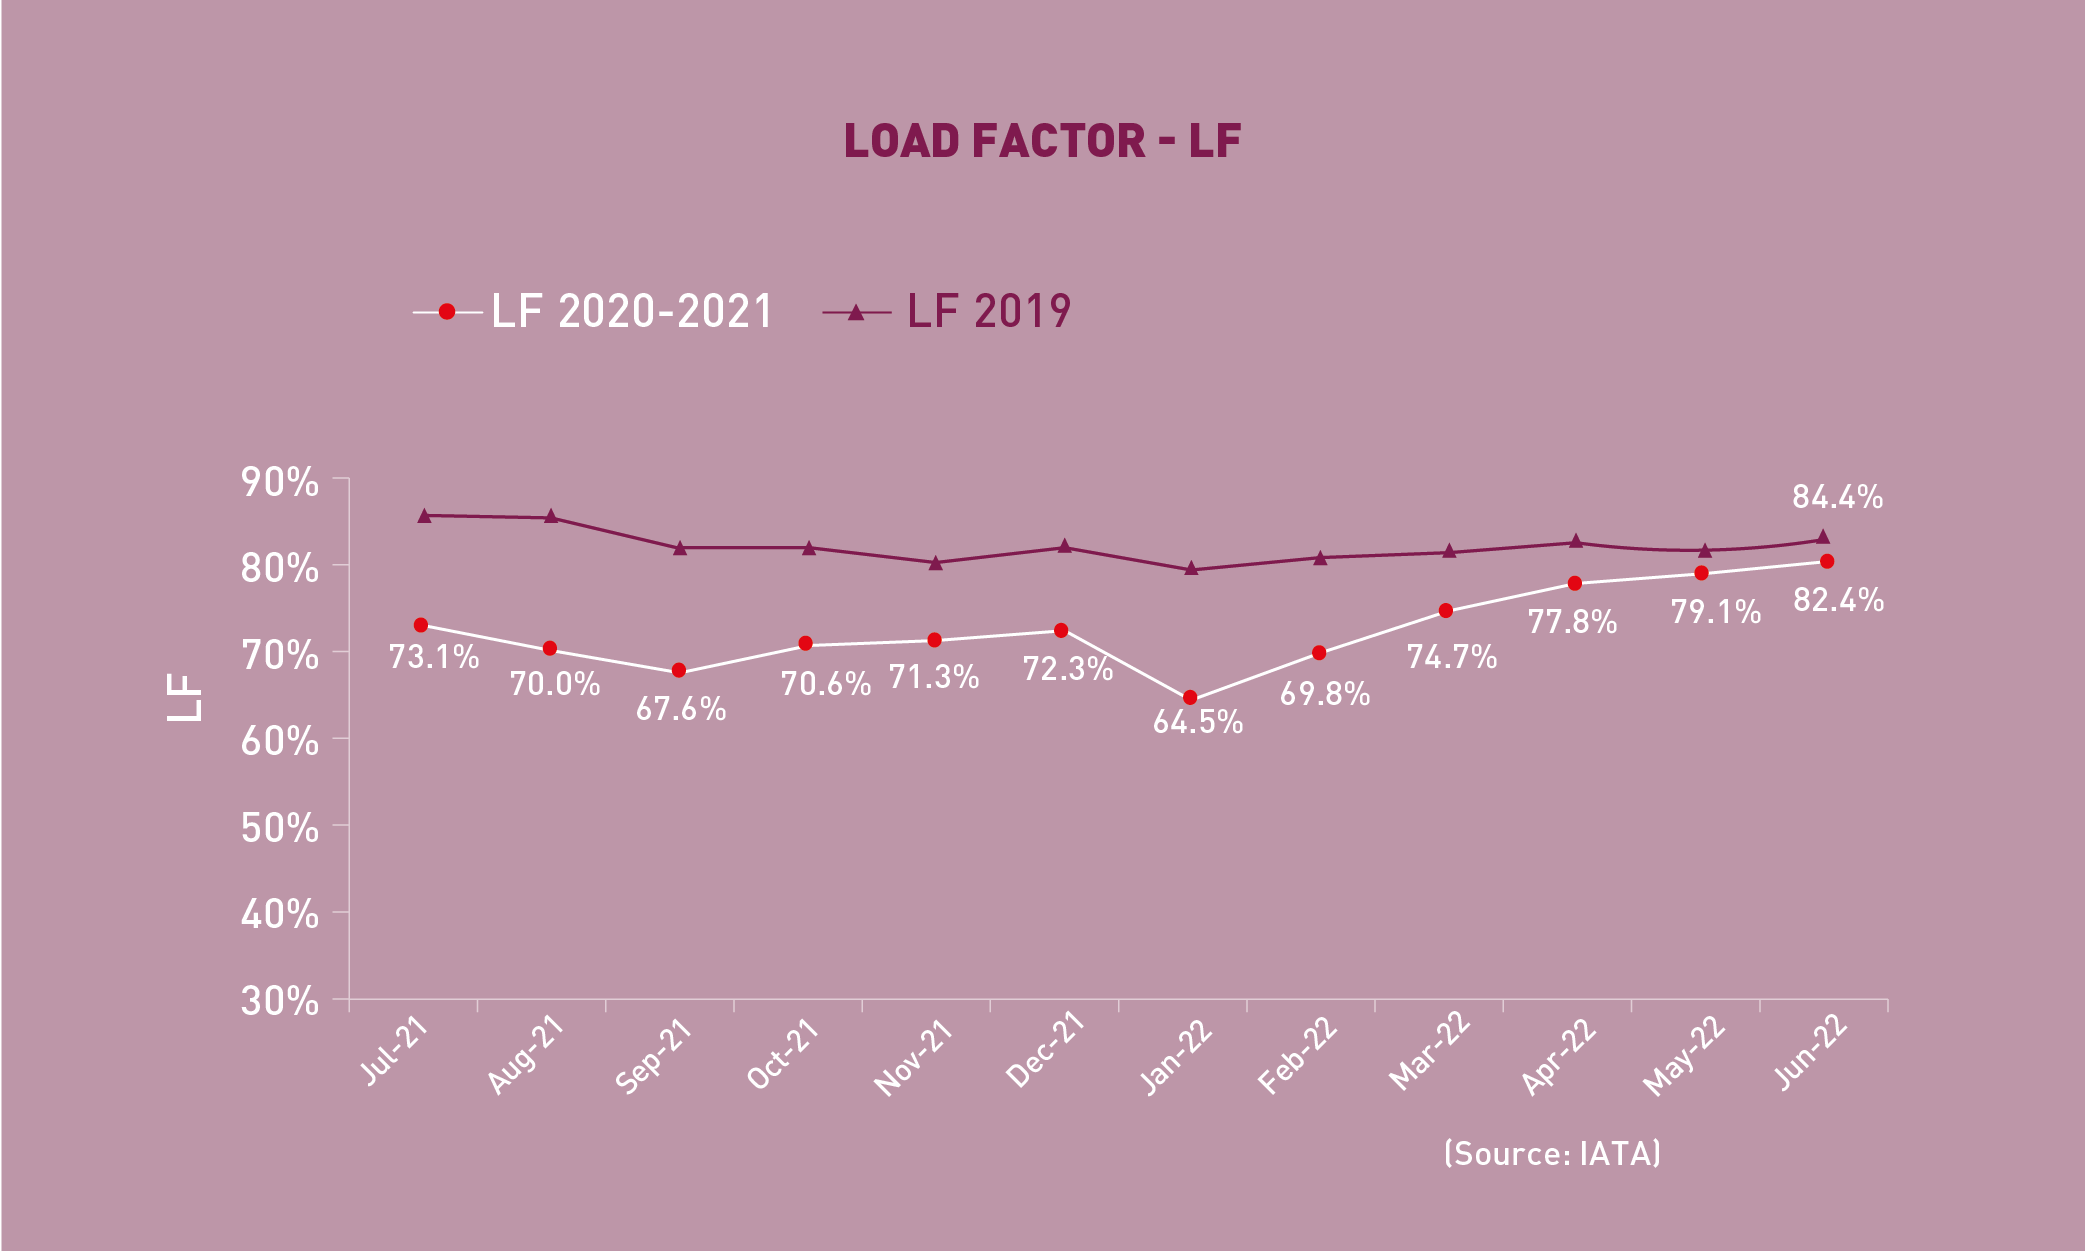 Load Factor
 The passenger Load Factor reached 82.4% in June 2022, +3.3 percentage points higher than the previous month. The continued upward trend in load factor drove the June figure -2.0 percentage points down from the level seen in the same month of 2019.
Cargo Traffic
![]() Cargo (Freight) Tonne-Kilometres – CTK
Cargo (Freight) Tonne-Kilometres – CTK
 Cargo (Freight) Tonne-Kilometres – CTK
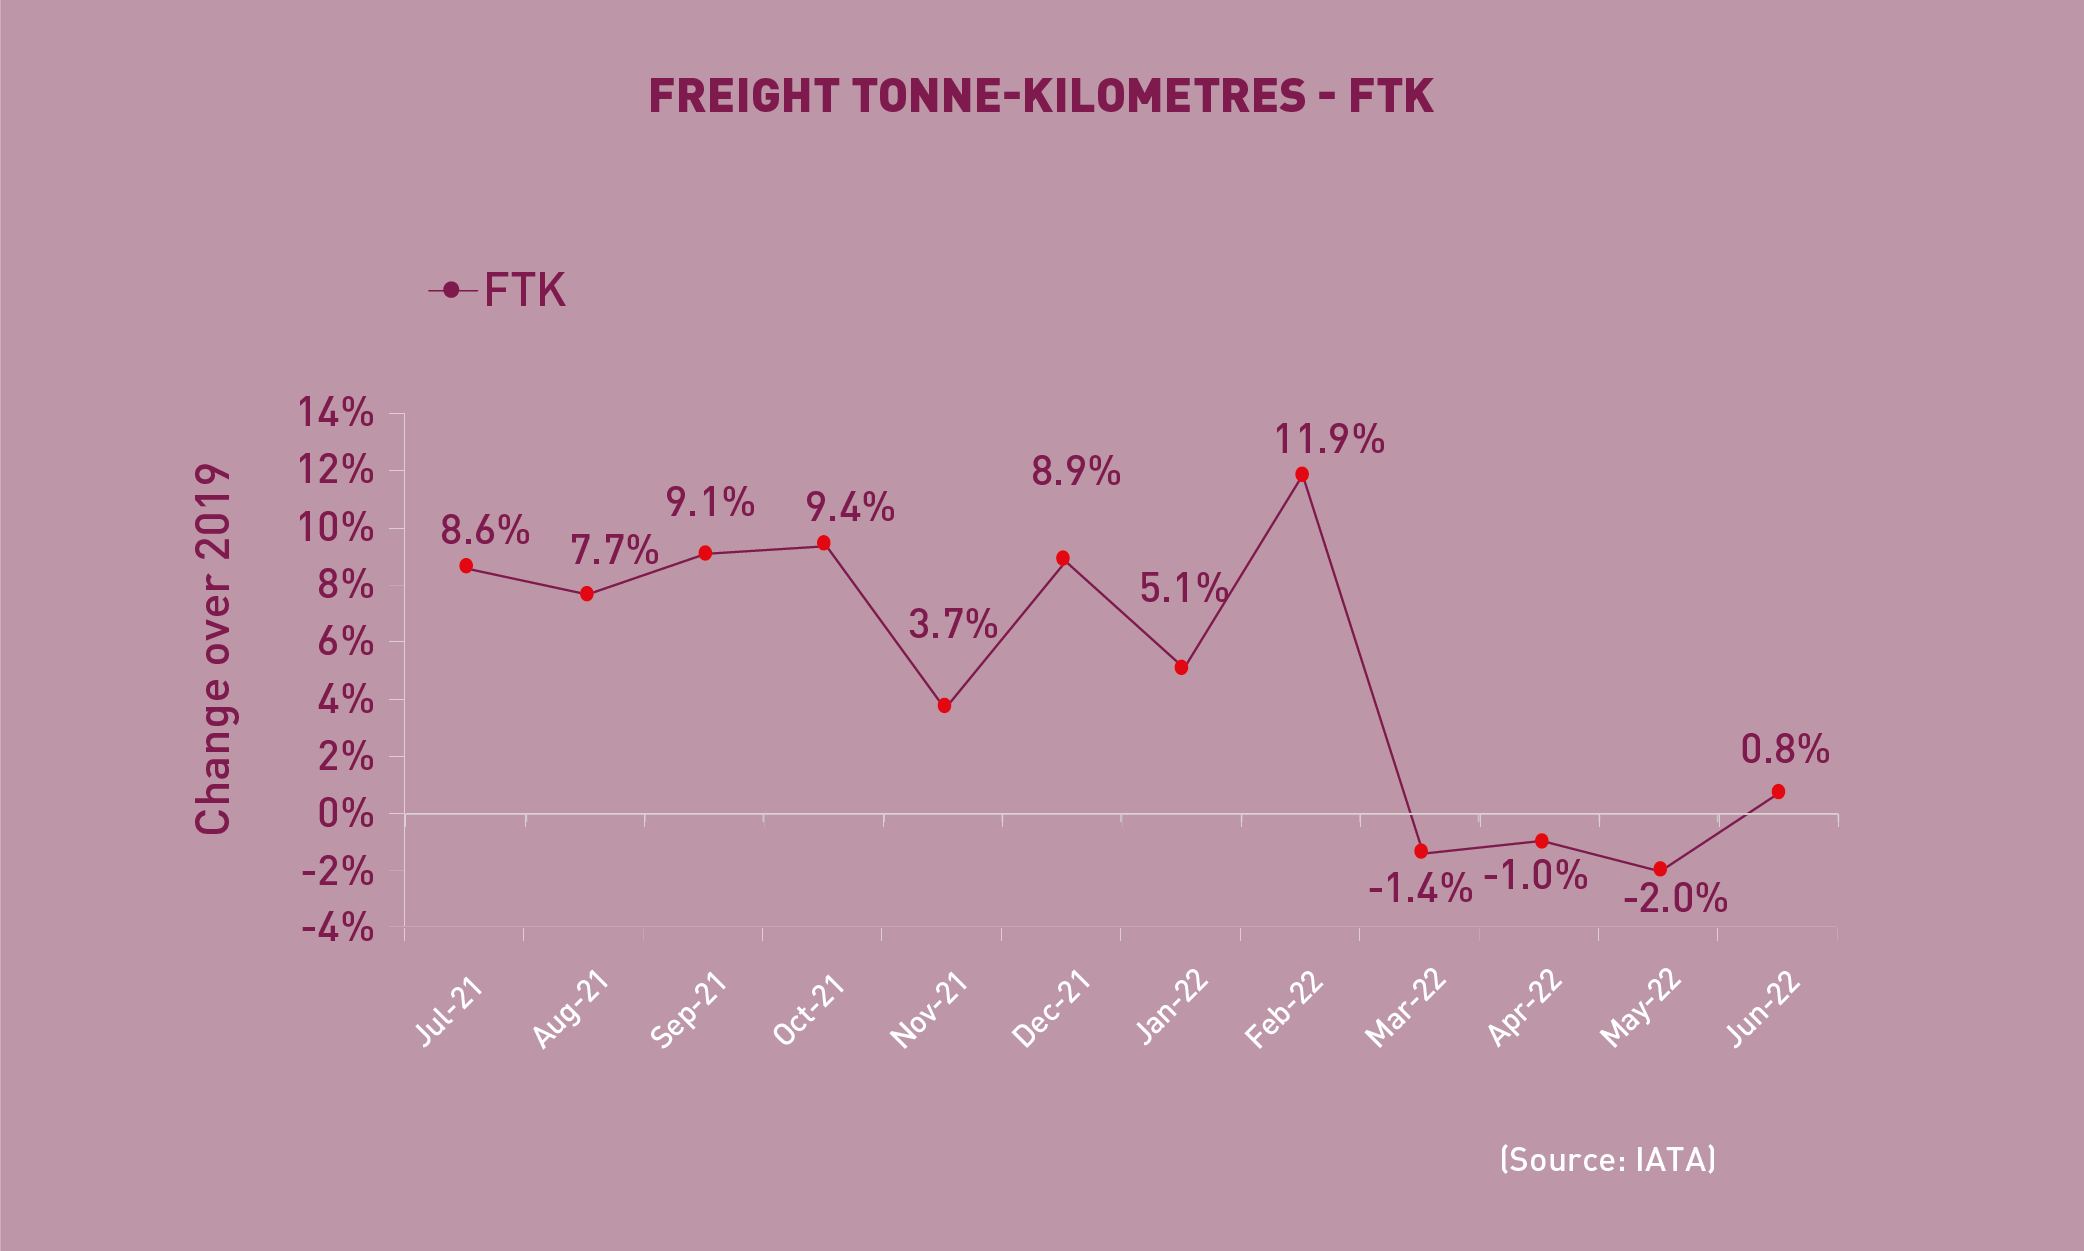
World cargo traffic in June 2022 was 0.8% above the 2019 level, +2.8 percentage points up from the decline in the previous month. Following three months of declines, air cargo traffic growth returned to a positive rate. Facing various headwinds at present, the growth of air cargo in the near term remains uncertain. Three regions, i.e. North America, Africa and the Middle East, posted gains compared to 2019, with the former two increased double-digitally. Europe was the weakest performing region, in part due to the impact of the war on Within Europe market. Asia/Pacific remained below 2019 level, however, it showed significant improvement month-on-month, owing to the ease of lockdown restrictions in China.
Top 15 Airports (Ranked by aircraft departures, passengers, and volume of freight)
Note: Figures include total scheduled and non-scheduled services
June 2022: –10.0%, -15.1%, and +7.9% (vs. 2019) in terms of aircraft movements, passengers and freight for the Top 15
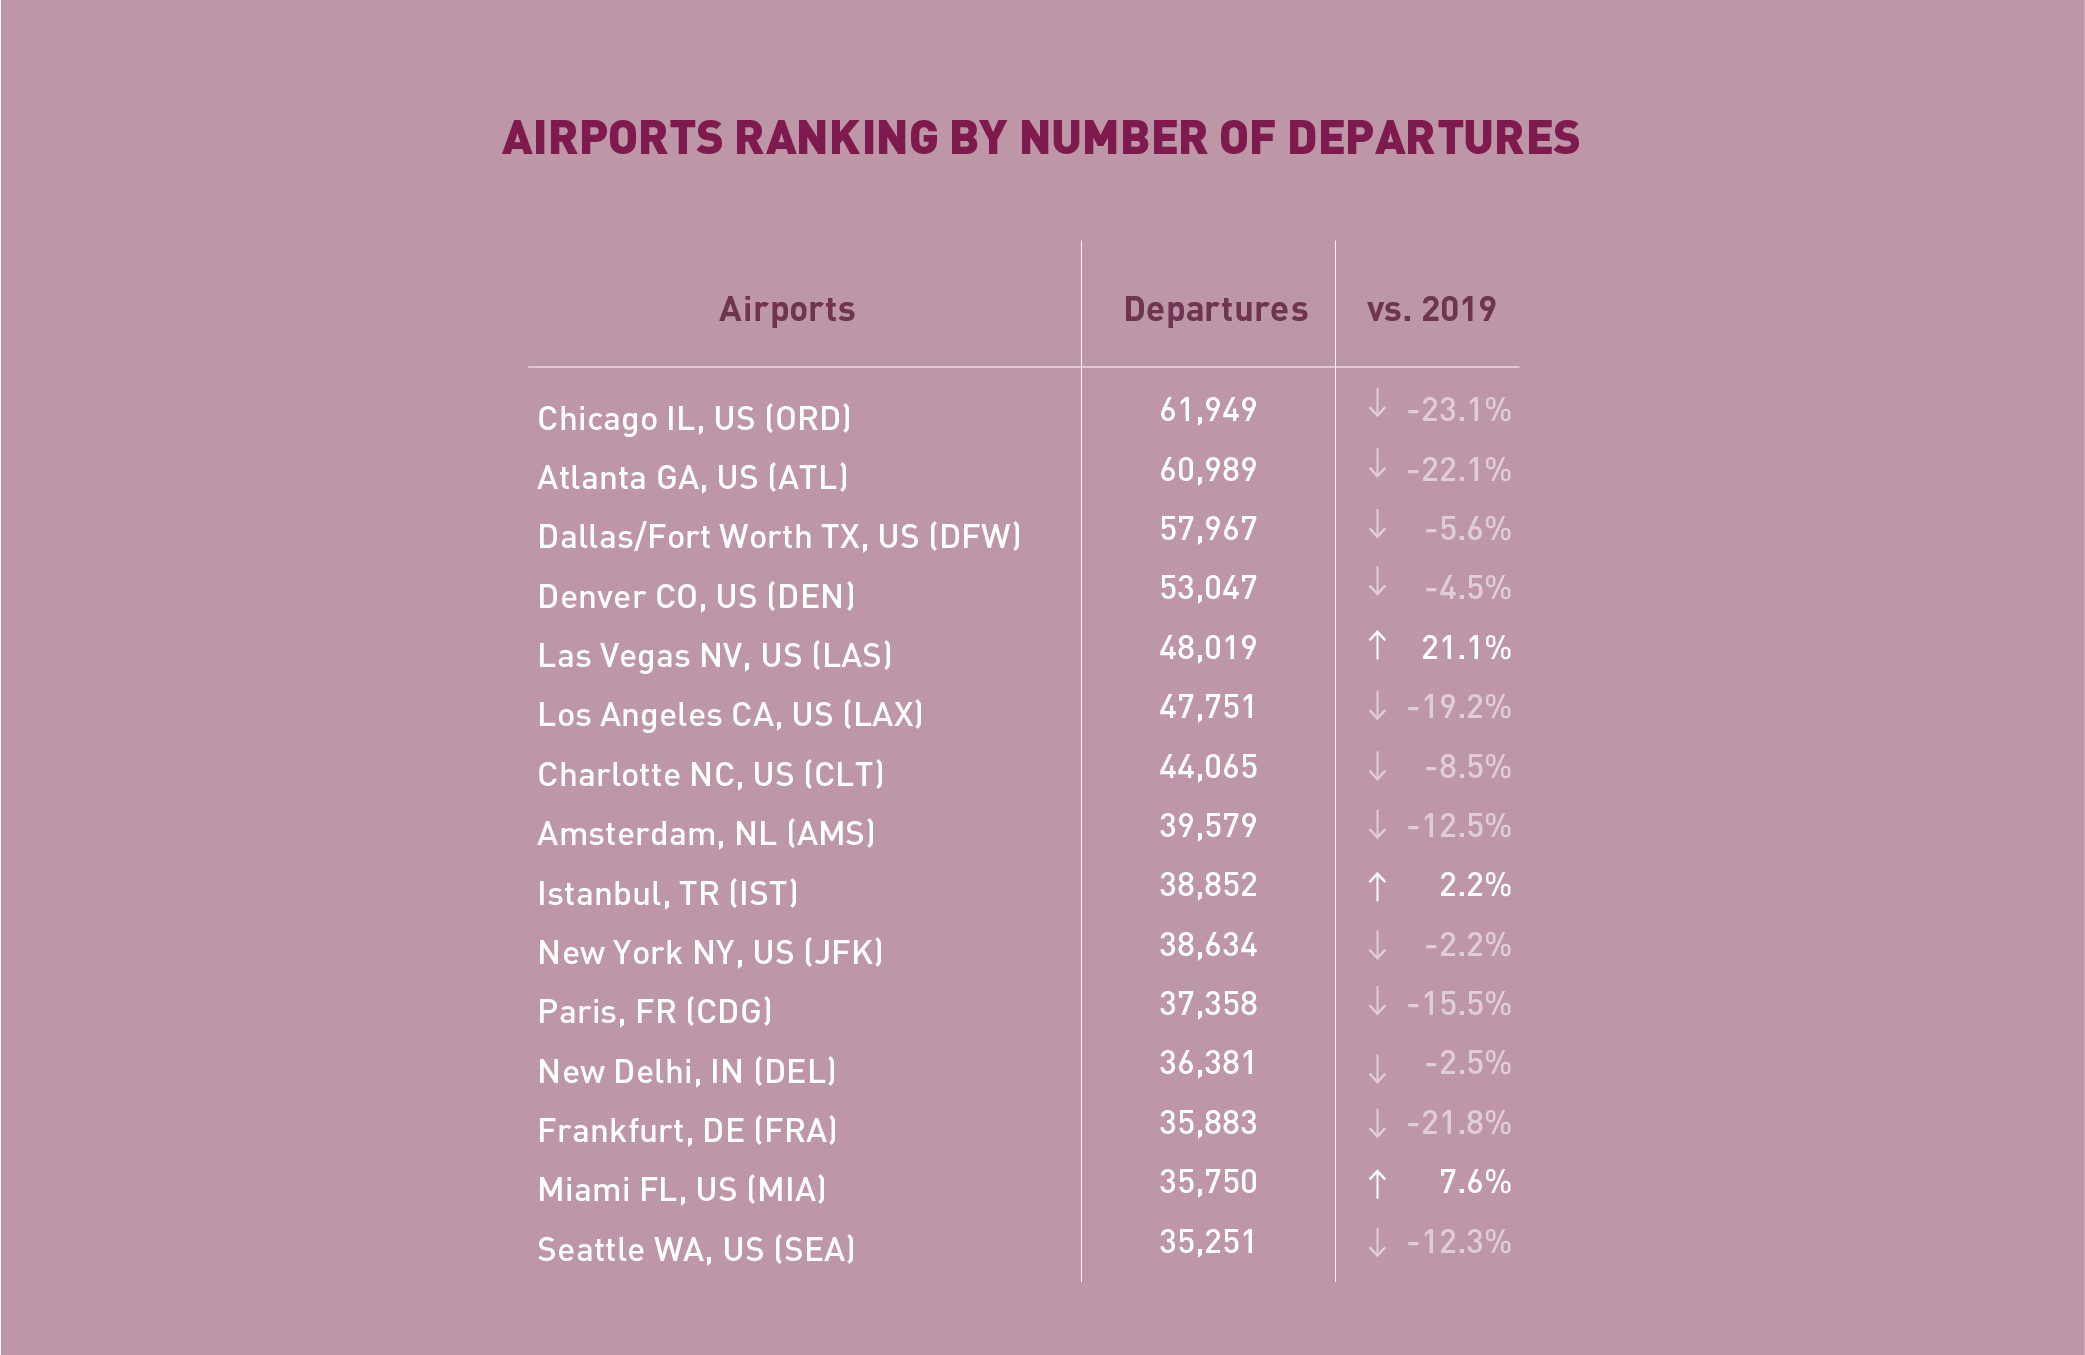
In terms of aircraft movements, the Top 15 airports reported a combined fall of -10.0% compared to 2019. Ten out of the Top 15 airports were US airports. Chicago remained 1st, albeit recording the largest decline of -23.1%. Three airports posted increases, i.e., Las Vegas, Istanbul, and Miami. The former recorded a robust growth of +21.1%.
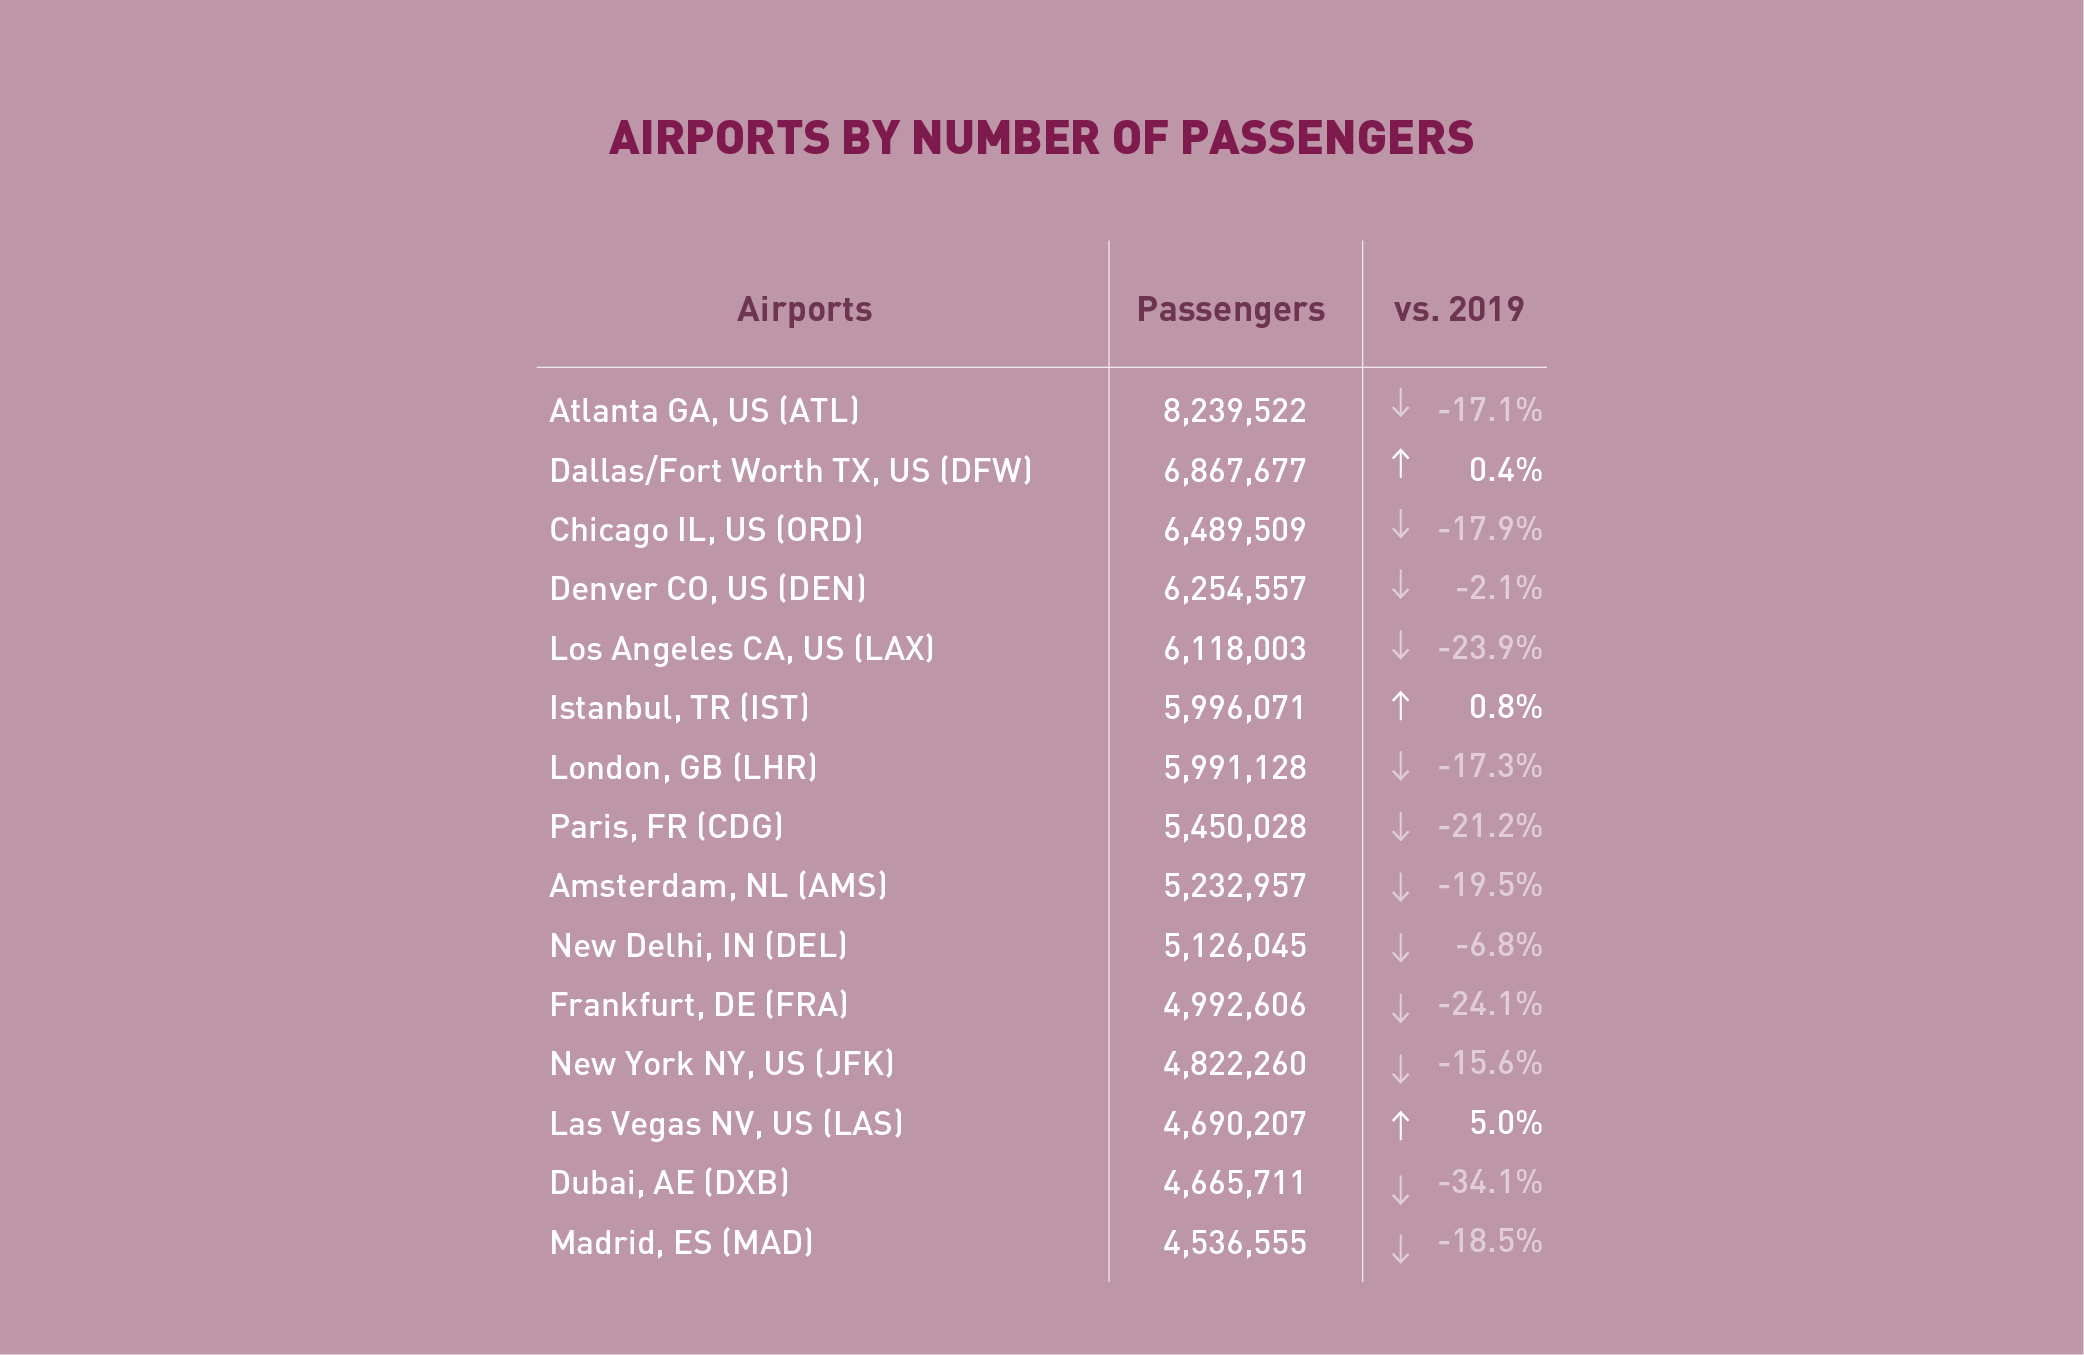
In terms of passengers, the Top 15 airports posted a total fall of -15.1%, compared to 2019. The Top 15 list was dominated by airports in the US and Europe. Atlanta remained 1st with a decline of -17.1%. Dubai recorded the largest fall of -34.1%, followed by Frankfurt (-24.1%) and Los Angeles (-23.9%). Three airports posted increases, i.e., Dallas/Fort Worth, Istanbul, and Las Vegas.
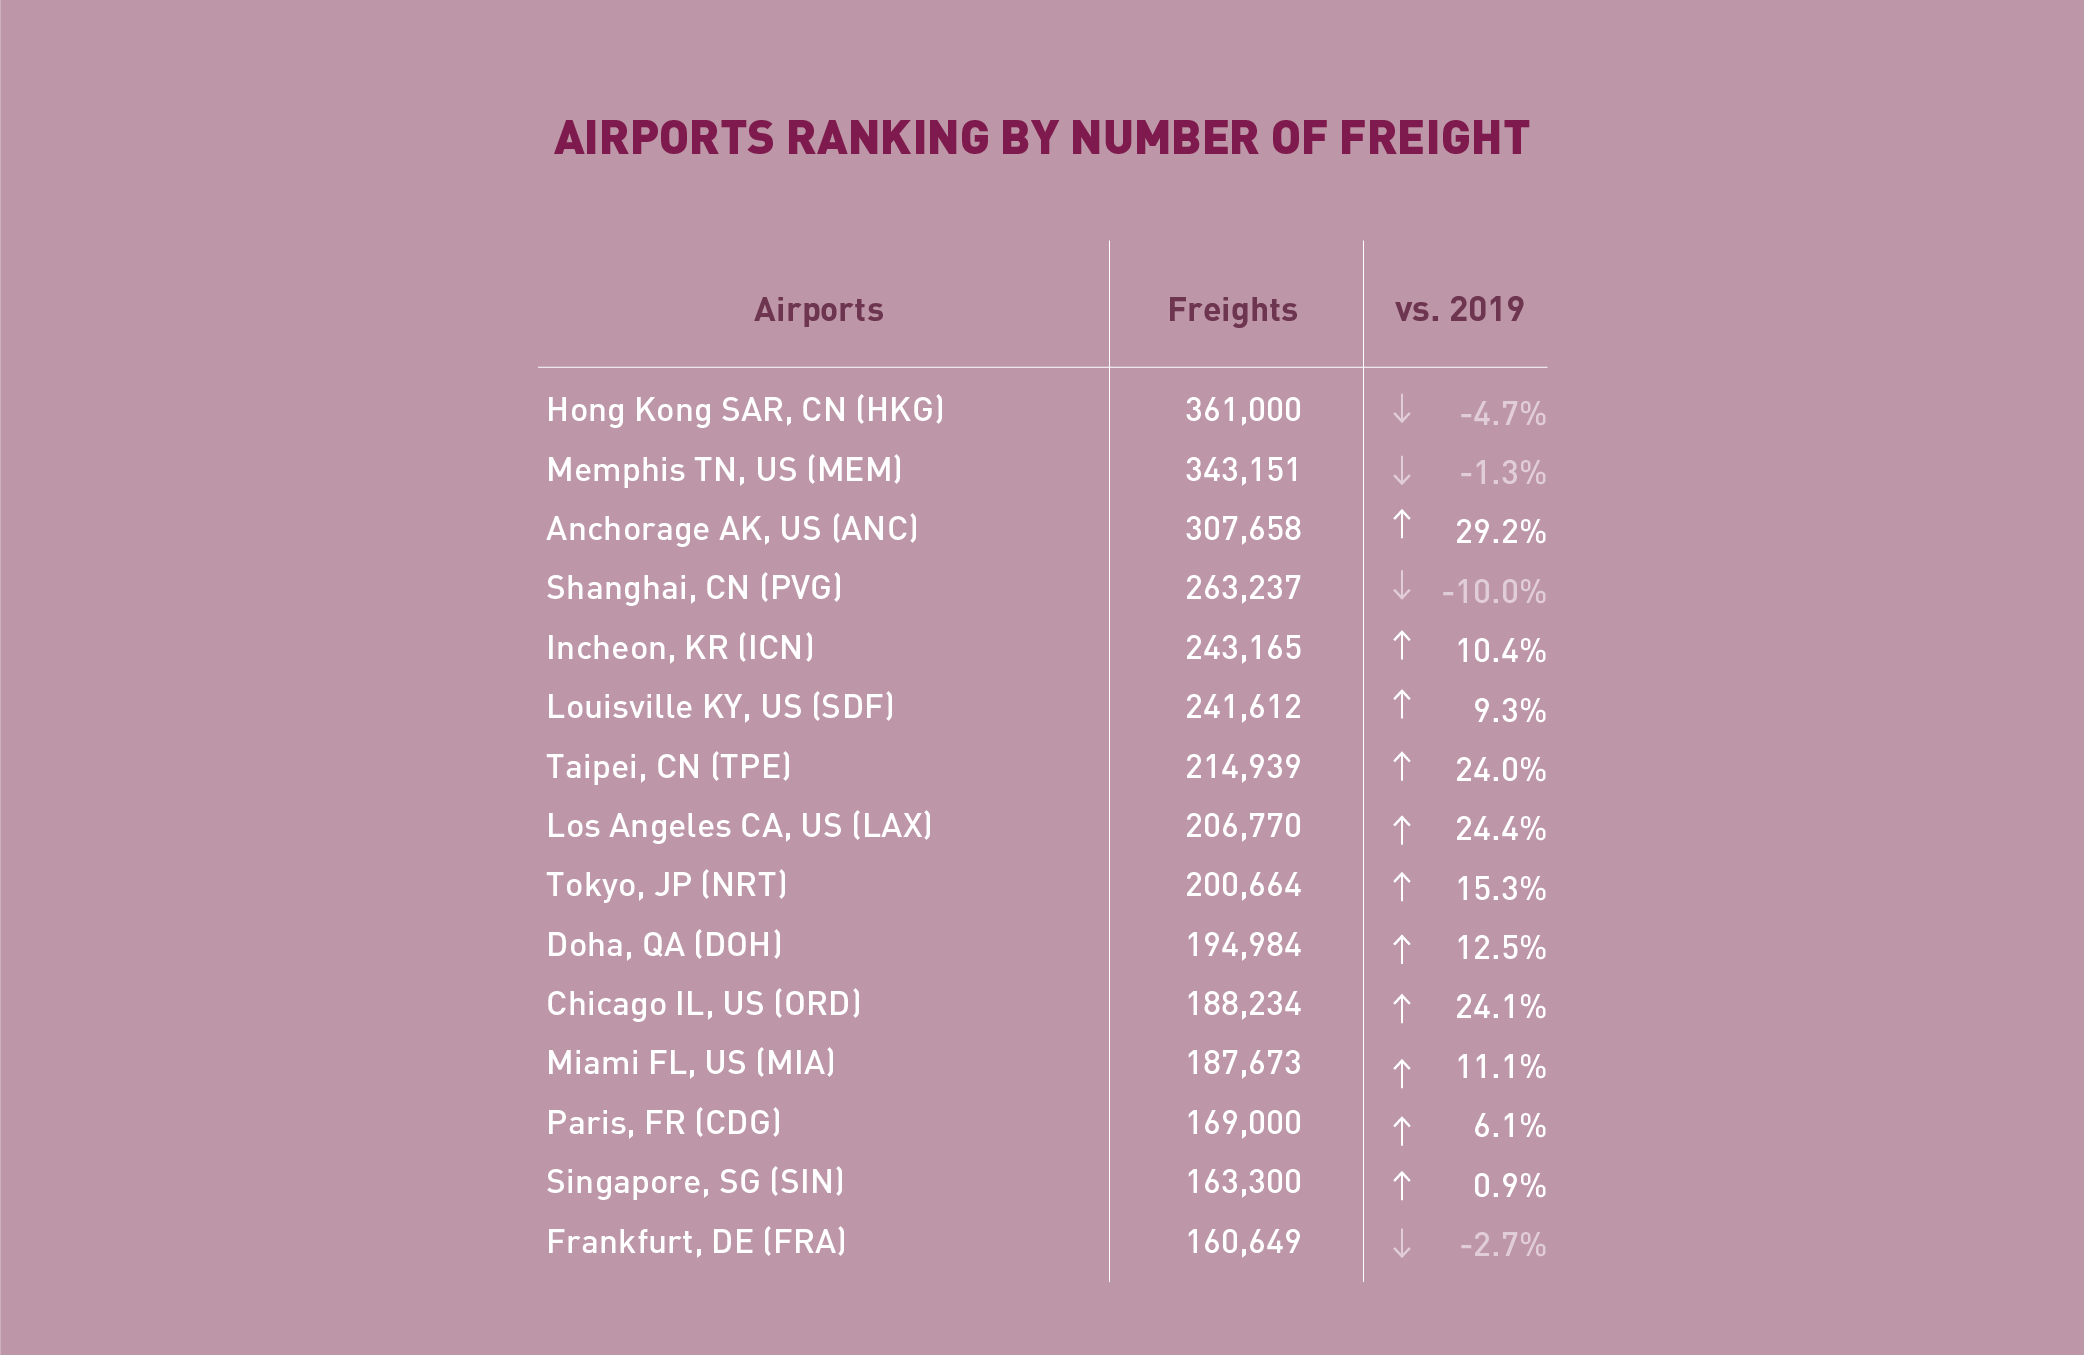 In terms of freight, the Top 15 airports reported an increase of +7.9%, compared to 2019. Over half of the Top 15 airports posted double-digital growth. Anchorage recorded the strongest growth at +29.2%, followed by Los Angeles at +24.4%. Four airports posted declines, with Shanghai recording the largest fall of -10.0%, followed by Hong Kong at -4.7%.
Top 15 Airline Groups (Ranked by RPK)
June 2022: –19.8% (vs. 2019) in terms of RPK for the Top 15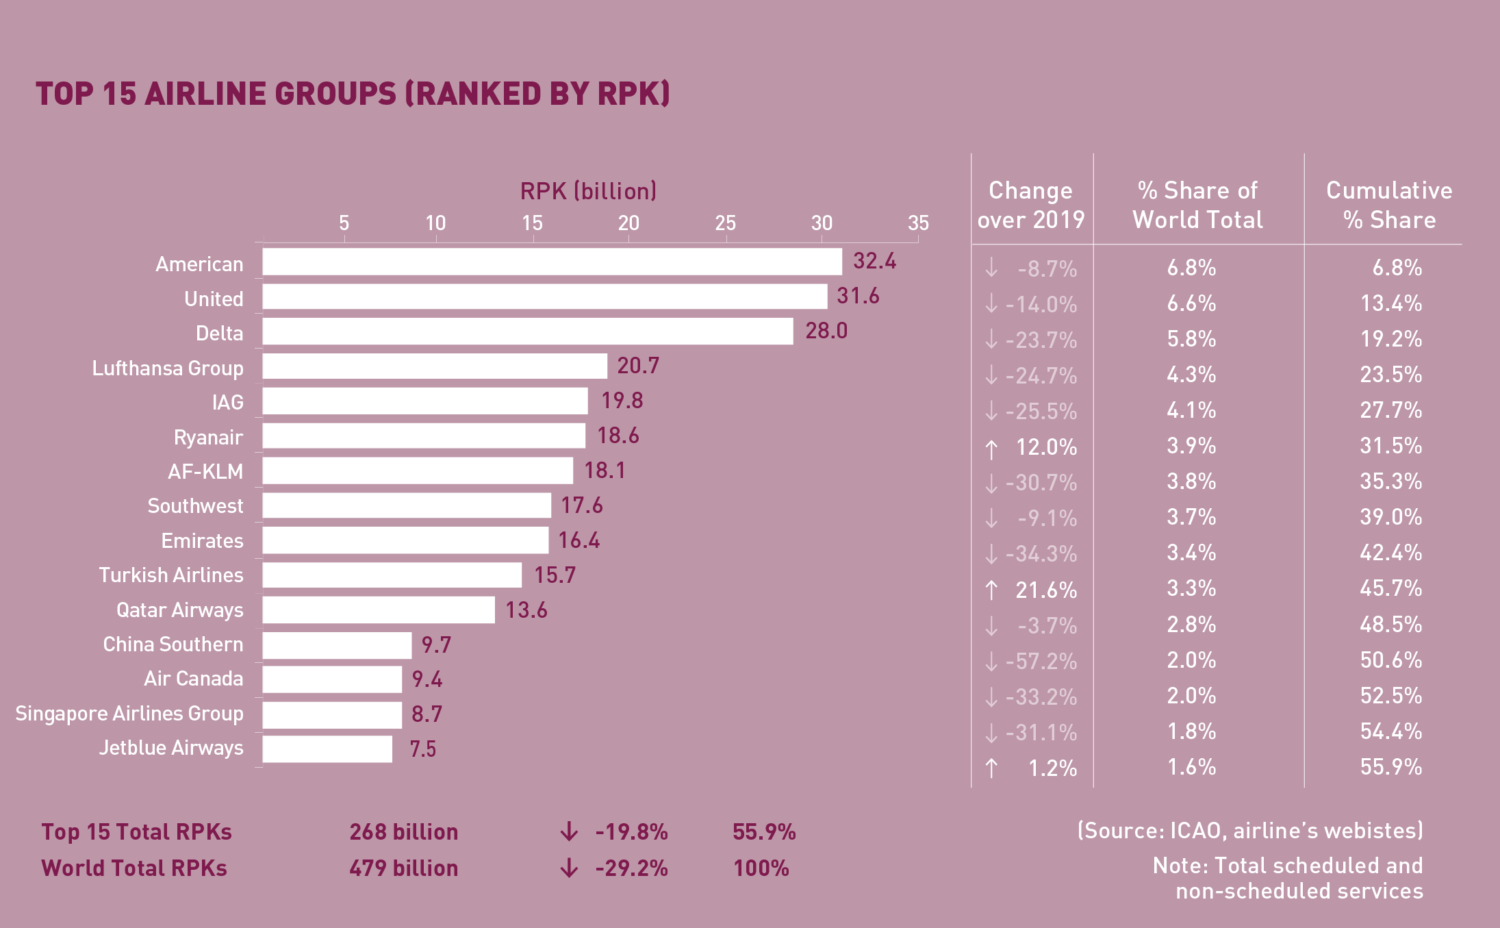 In terms of RPK, the Top 15 airline groups accounted for 55.9% of the world’s total RPK in June 2022 and declined by –19.8% compared to 2019. This decline was 9.4 percentage points smaller than the fall in the world’s average RPK. The Top 15 airlines continued to show fluctuation due to the diverse pace of recovery among regions.
The US airlines retained the Top 3 positions, with American at 1st, followed by United and Delta. Rankings of Southwest and Jetblue dropped slightly, overtaken by airlines in Europe and Asia/Pacific. Airlines in Europe continued to show improvements supported by the surge in international travel. Lufthansa, IAG, Ryanair, and AF-KLM occupied the positions from 4th to 7th. Turkish Airlines maintained 10th place.
The performance of airlines in the Middle East was relatively stable. Emirates dropped 1 position to 9th, while Qatar retained 11th.
After disappearing from the Top 15 list for two months, China Southern re-appeared in the list and ranked 12th, however, the airline recorded the largest decline among the Top 15 group at -57.2%. Singapore Airlines kept the 14th position with a decline of -31.1%.
Capacity by Region
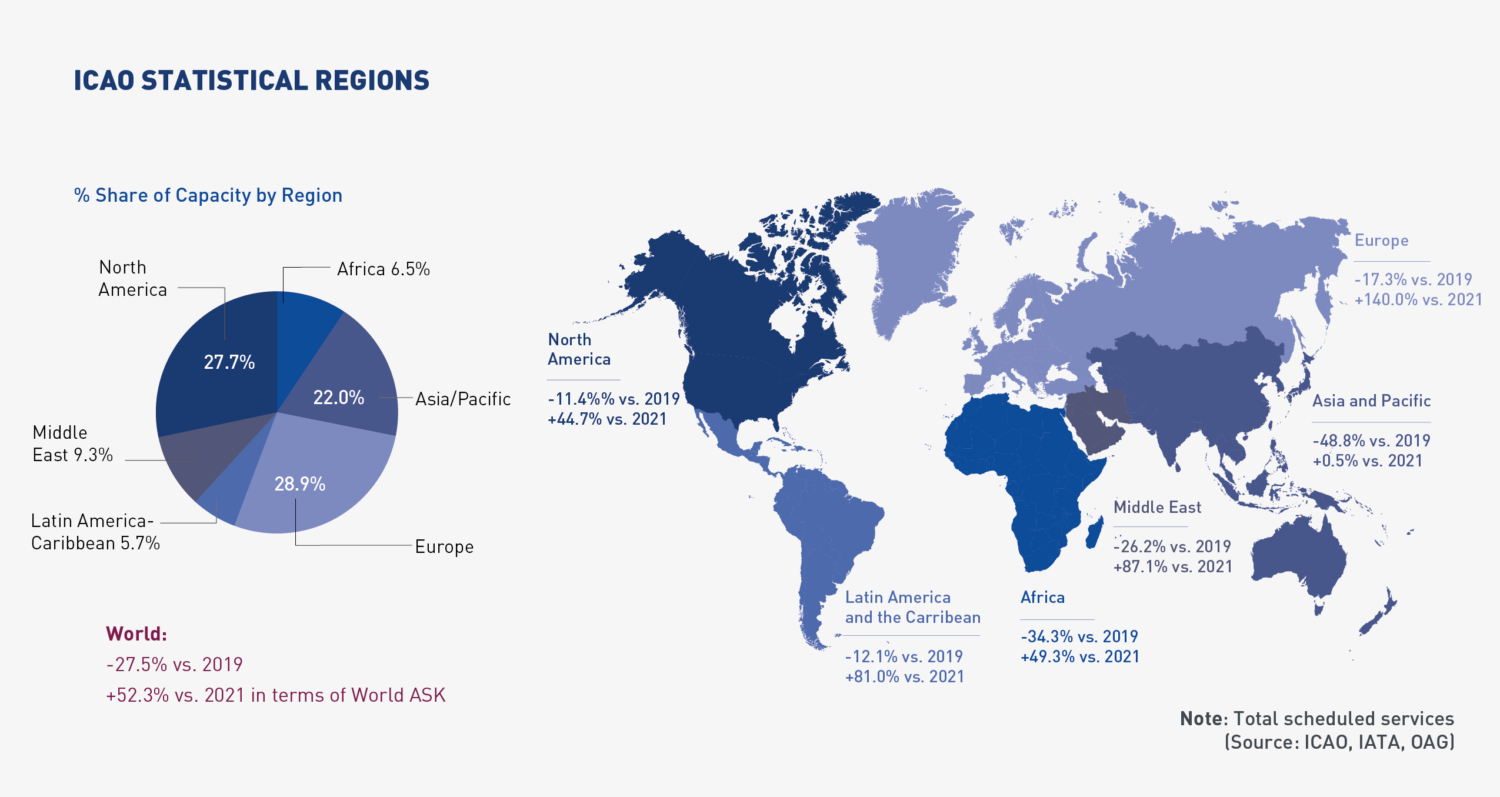
June 2022: -27.5% (vs. 2019) in terms of World ASK
Worldwide capacity contracted by -27.5% in June 2022, compared to 2019. Capacity offered by airlines posted slight improvements over the previous month, with only Asia/Pacific and Latin America/Caribbean recording smaller declines. The other regions posted a modest month-on-month decline, except for the Middle East, which saw a decline by over 10 percentage points.
Click here to download the Monthly Monitor in a PDF version.
For any queries for further information, please contact the ICAO Economic Development (ECD), Air Transport Bureau ecd@icao.int
Acronyms: ACI: Airports Council International; ASK: Available Seat-Kilometres; IATA: International Air Transport Association; FTK: Freight Tonne-Kilometres; LF: Passenger Load Factor; OAG: Official Airline Guide; RPK: Revenue Passenger-Kilometres; UNWTO: World Tourism Organization; YoY: Year-on-year; YTD: Year-to-date.