The air transport industry is not only a vital engine of global socio-economic growth, but it is also of vital importance as a catalyst for economic development. Not only does the industry create direct and indirect employment and support tourism and local businesses, but it also stimulates foreign investment and international trade.
Informed decision-making is the foundation upon which successful businesses are built. In a fast-growing industry like aviation, planners and investors require the most comprehensive, up-to-date, and reliable data. ICAO’s aviation data/statistics programme provides accurate, reliable and consistent aviation data so that States, international organizations, the aviation industry, tourism and other stakeholders can:
- make better projections;
- control costs and risks;
- improve business valuations; and
- benchmark performance.
The UN recognized ICAO as the central agency responsible for the collection, analysis, publication, standardization, improvement and dissemination of statistics pertaining to civil aviation. Because of its status as a UN specialized agency, ICAO remains independent from outside influences and is committed to consistently offering comprehensive and objective data. Every month ICAO produces this Air Transport Monitor, a monthly snapshot and analysis of the economic and aviation indicators.
ECONOMIC DEVELOPMENT – August 2021
World Results and Analyses for June 2021
Total Scheduled Services (Domestic and International)
Passenger traffic
 Revenue Passenger-Kilometres – RPK
World passenger traffic fell by -60.1% in June 2021 (compared to 2019), +2.6 percentage points up from the decline in the previous month. Although the traditional demand driver – economic activity – has been showing an upward trend, air travel continued to be largely affected by the rising COVID-19 cases and strict travel restrictions amid the spread of new variants. Overall, for the first half of 2021, passenger traffic remained at more than -60% below the 2019 levels, with the Middle East and Europe recording the weakest performance.
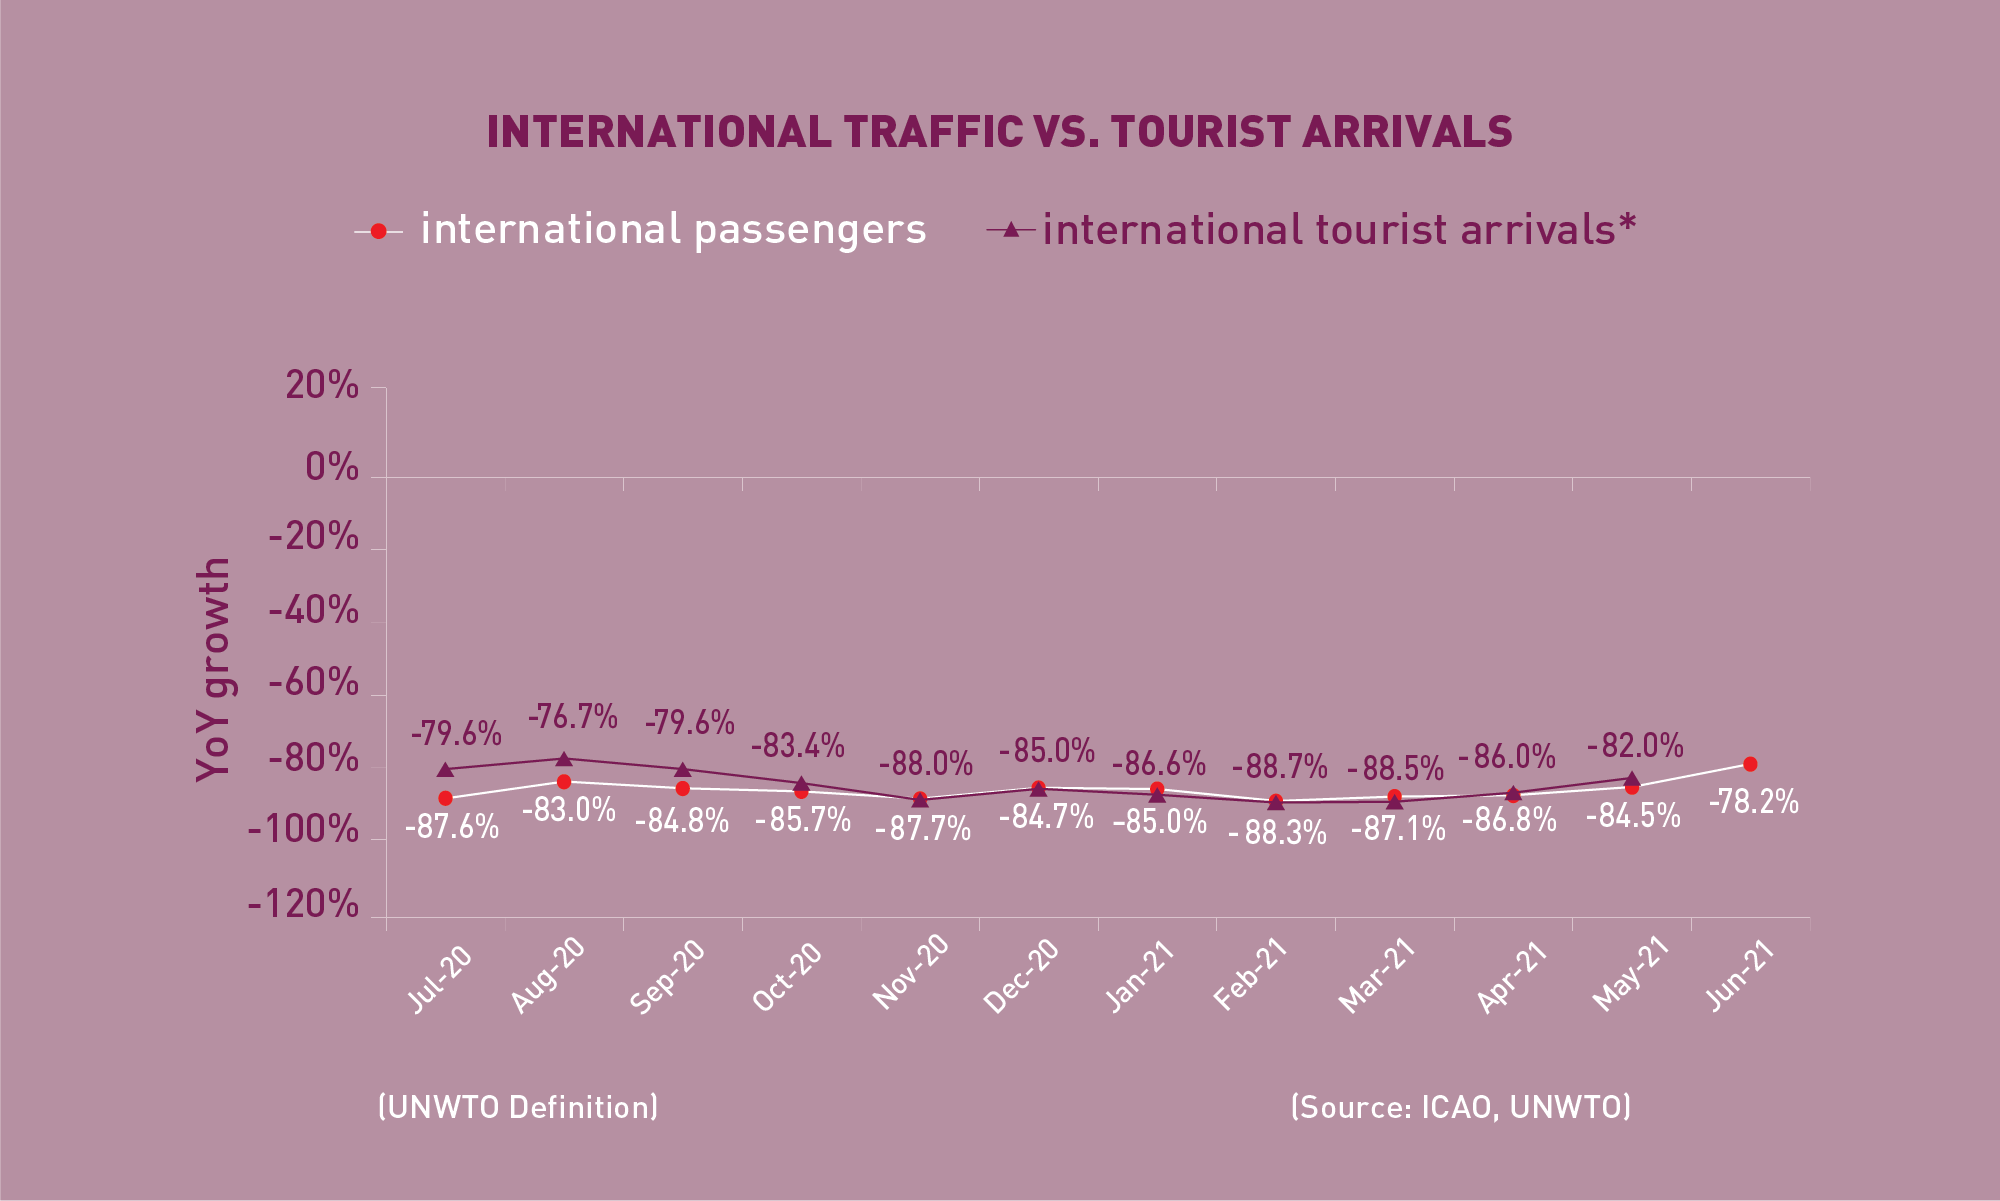 International Traffic vs. Tourist Arrivals
International passenger numbers fell by -78.2% in June 2021 (compared to 2019), +6.3 percentage points up from the decline in the previous month. Cross-border travel restrictions continued to weigh heavily on international travel demand. As a result, international traffic for the first half of 2021 was far below 2019 levels. The international tourist arrivals also remained stagnant and followed a similar trend as international passenger traffic.
Capacity
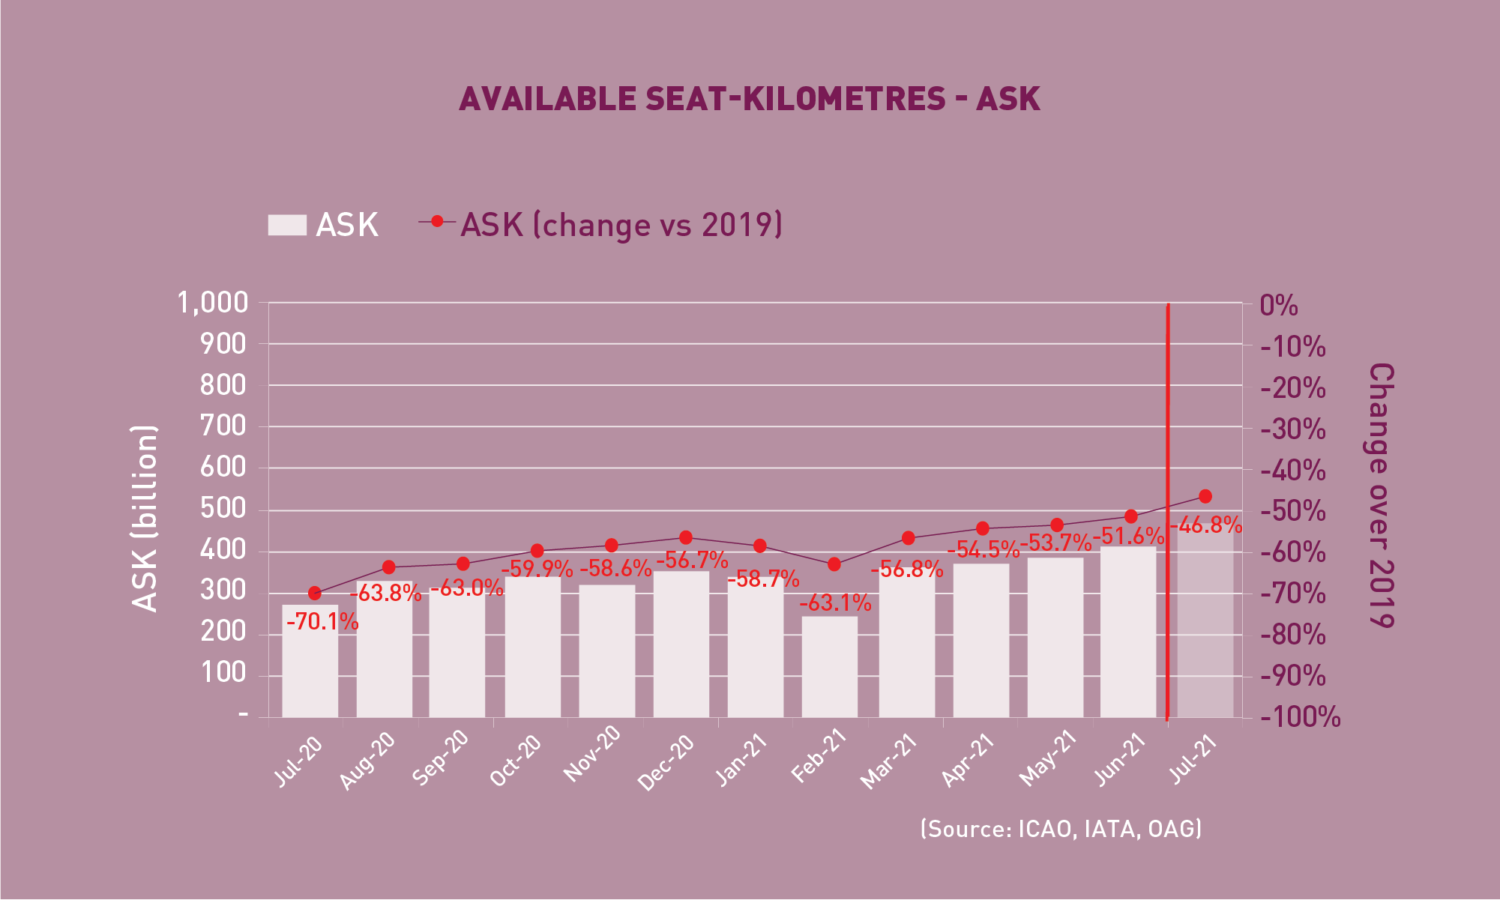 Available Seat-Kilometres – ASK
Capacity worldwide fell by -51.6% in June 2021 (compared to 2019), +2.1 percentage points up from the decline in the previous month (-53.7%). As air travel continues to recover, capacity is expected to increase in July 2021 to -46.8% down from the 2019 levels.
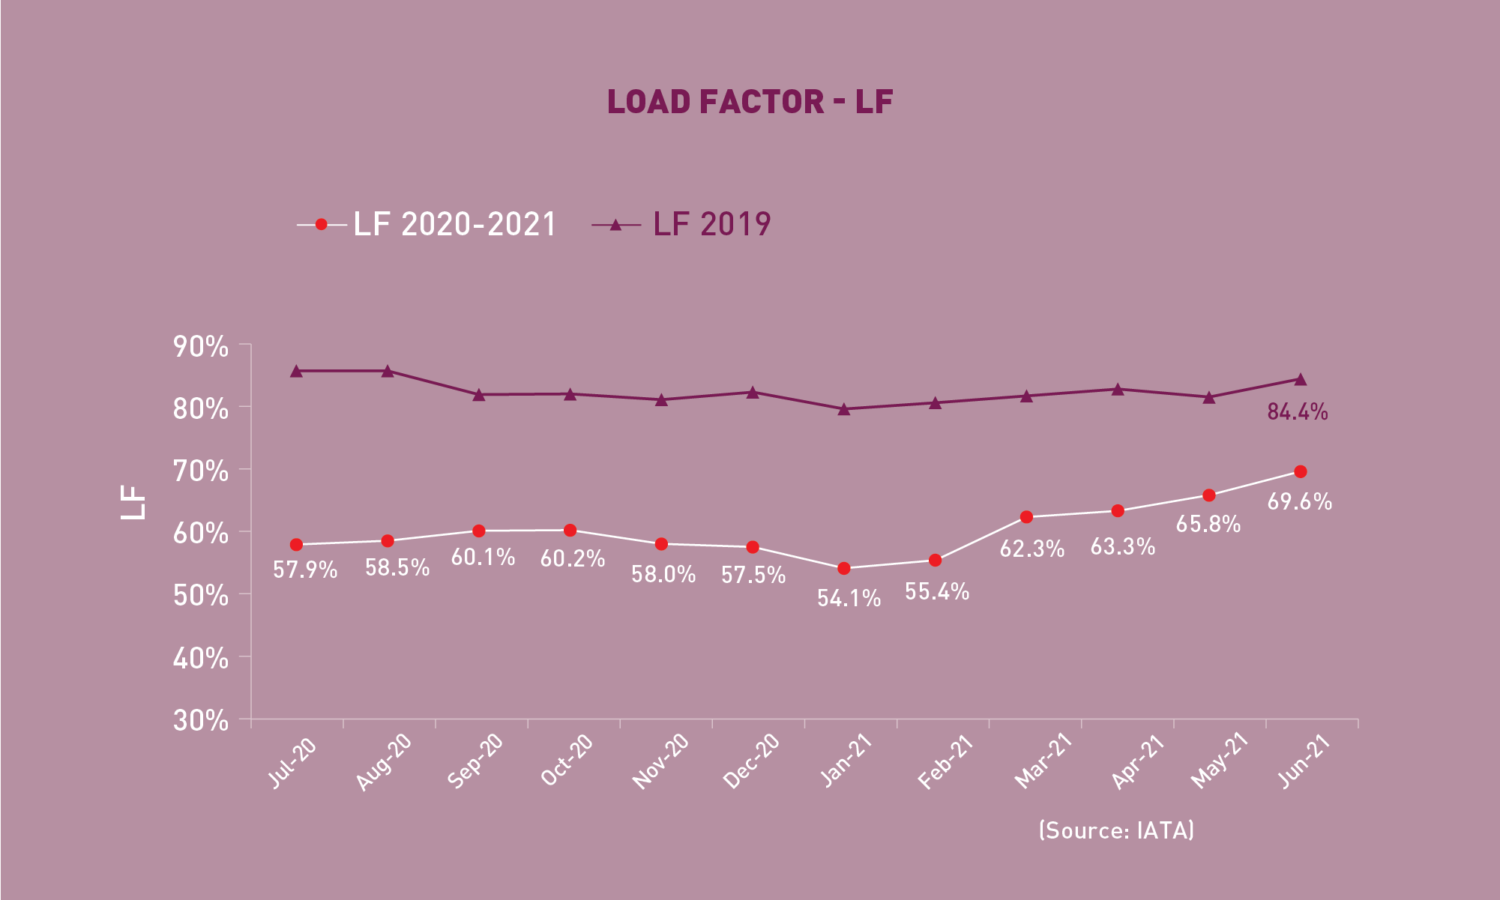 Load Factor
The passenger Load Factor reached 69.6% in June 2021, +3.8 percentage points higher than the previous month. The domestic load factor continued to show solid performance and returned to a little less than 80%. As the recovery of capacity was faster than travel demand recovery, the June LF remained significantly below 2019 levels at -14.8 percentage points lower.
![]() Freight Traffic
Freight Traffic
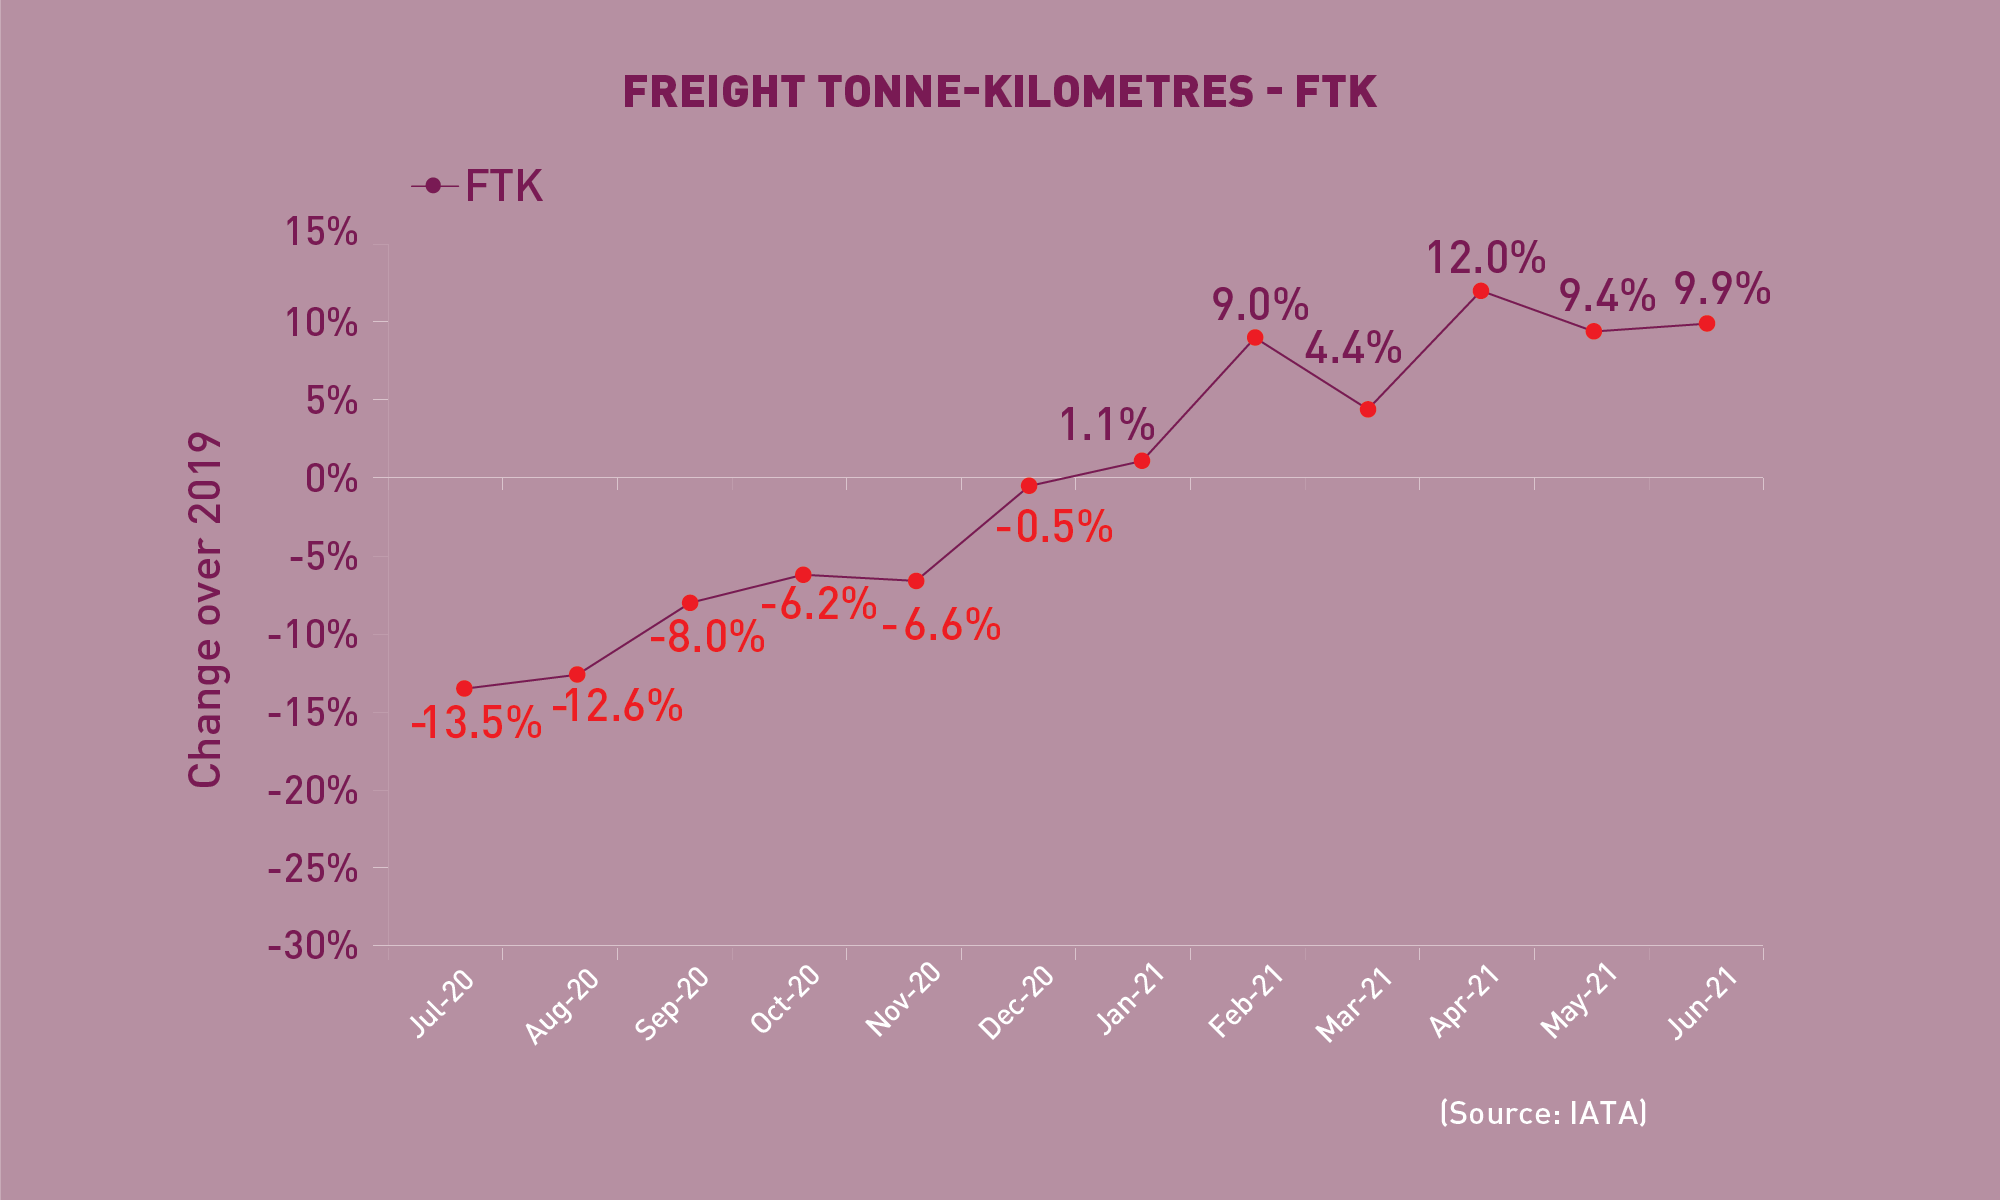
Freight Tonne-Kilometres – FTK
World freight traffic reported a growth of +9.9% in June 2021 (compared to 2019), +0.5 percentage point higher than the growth in the previous month. Air cargo sustained its strong growth supported by the continued increase in trade and manufacturing. Demand for air cargo is likely to further grow underpinned by the global economic recovery. Performance was mixed across regions. All regions, except for Latin America/Caribbean, have returned to pre-pandemic traffic levels. While Africa, North America, and the Middle East have shown double-digit growth, Asia/Pacific and Europe grew modestly. Overall, for the first half of 2021, air cargo was +8.0% above the 2019 levels.
Top 15 Airports (Ranked by aircraft departures, passengers, and volume of freight)
Note: Figures include total scheduled and non-scheduled services
June 2021: -10.6%, -23.5%, and +16.0% (vs. 2019) in terms of aircraft departures, passengers and freight for the Top 15
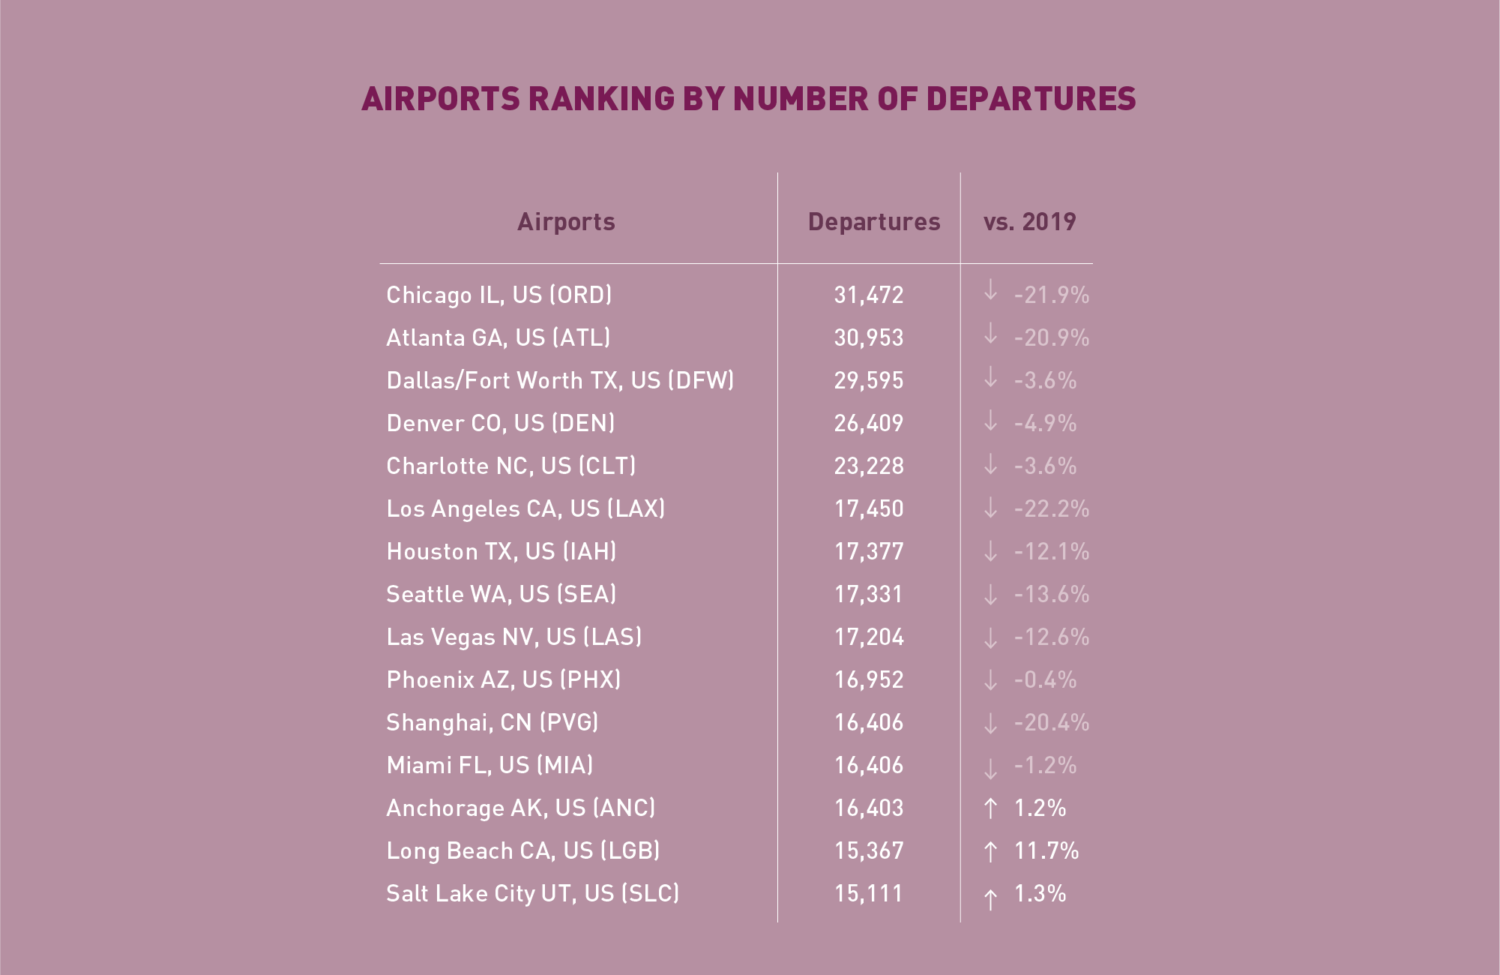
In terms of aircraft departures, the Top 15 airports reported a combined fall of -10.6%, compared to 2019. The Top 15 list consists mostly of US airports with only one Chinese airport (Shanghai). Chicago overtook Atlanta and became 1st with a decline of -21.9%. Three airports, Long Beach, Salt Lake City, and Anchorage posted increases compared to 2019.
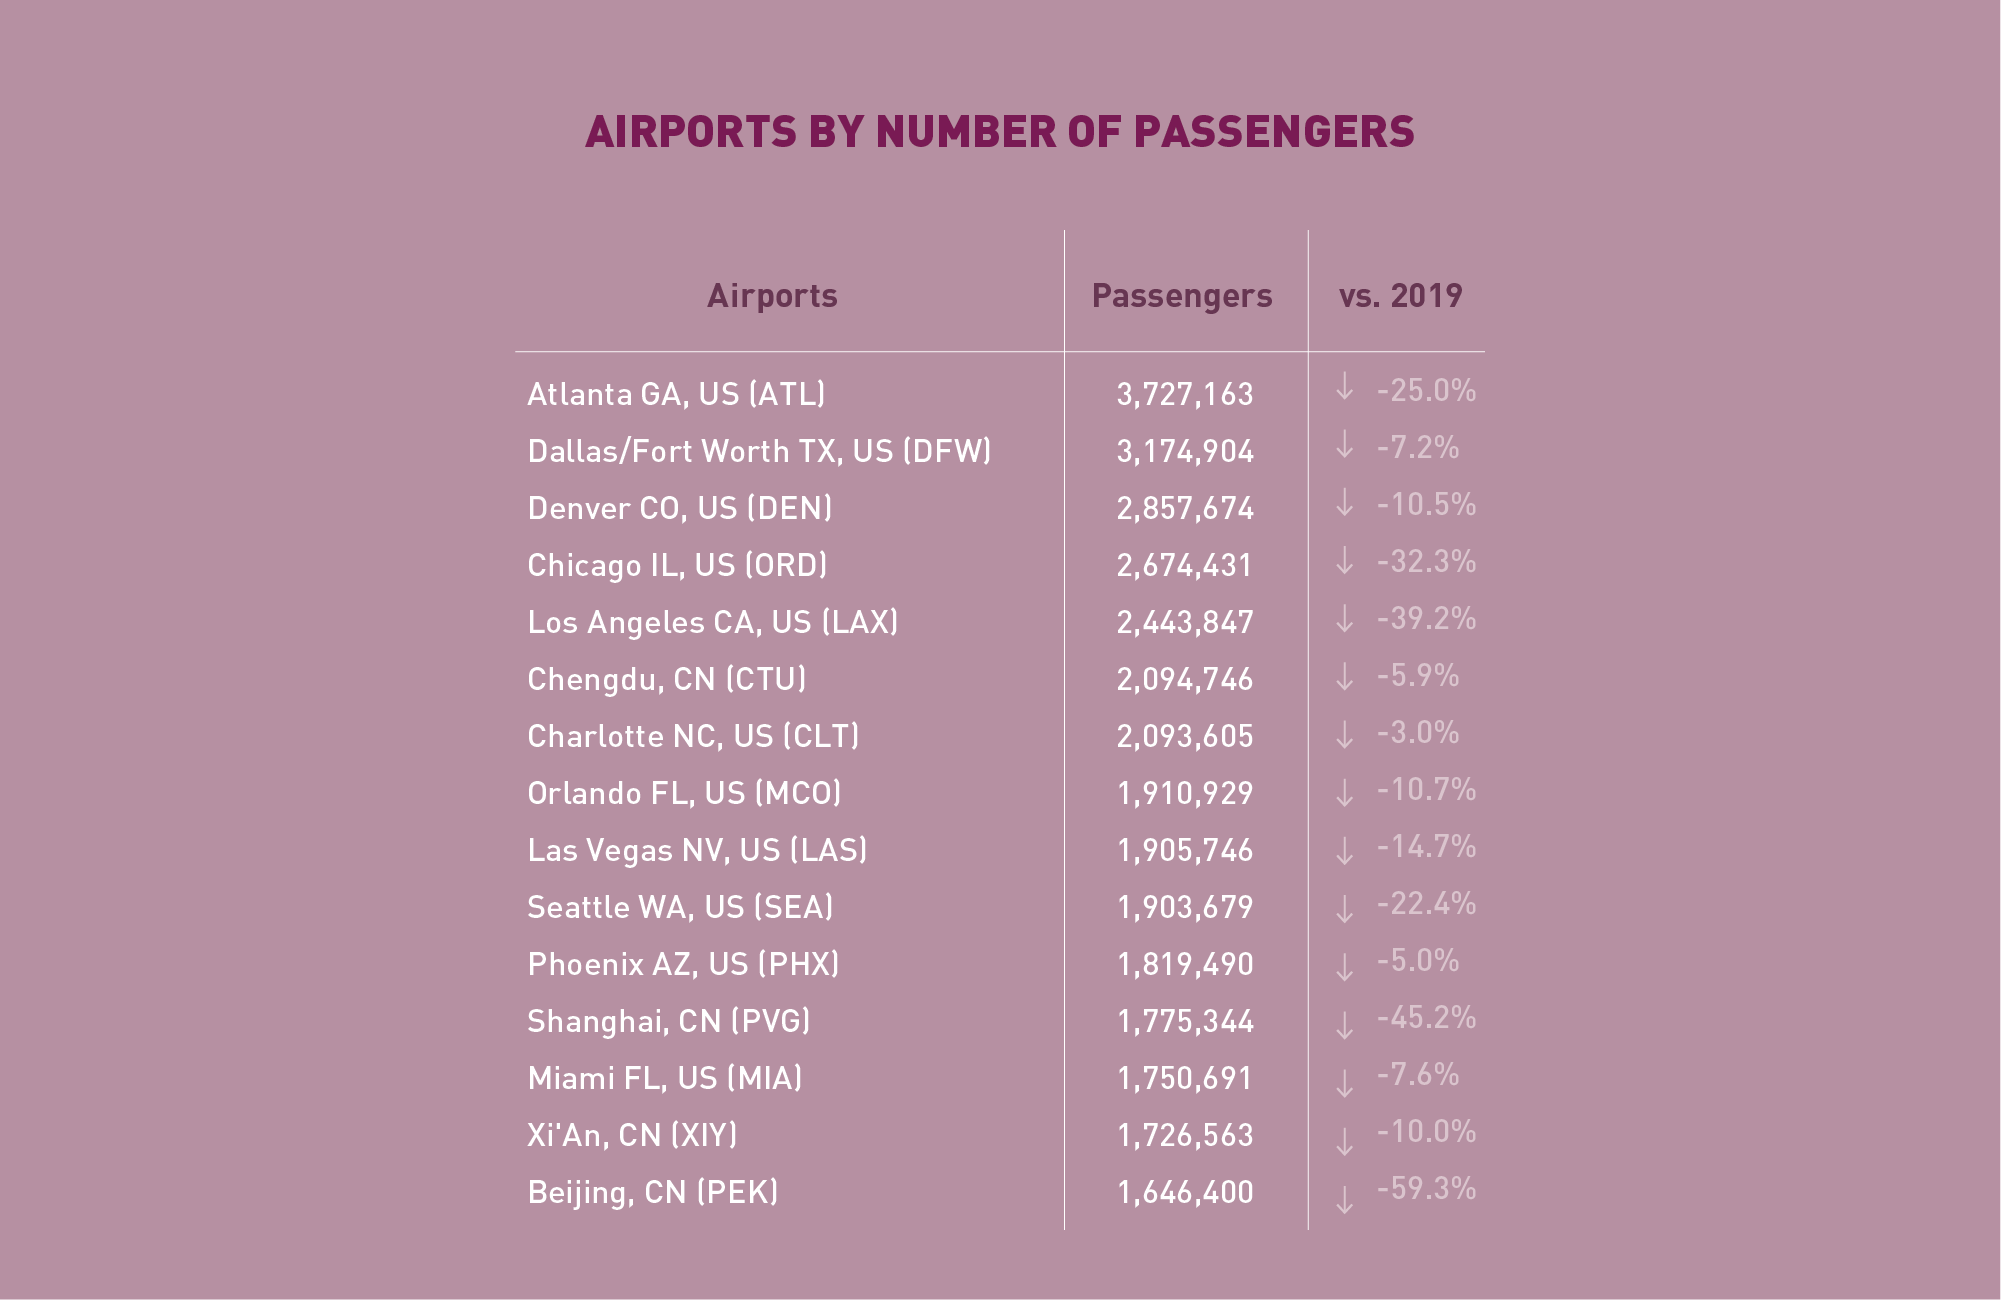
In terms of passengers, the Top 15 airports posted a total fall of -23.5%, compared to 2019. The list was dominated exclusively by US (11) and Chinese (4) airports. Atlanta remained at 1st with a -25.0% decline, followed by Dallas/Fort Worth. Two Chinese airports, Beijing and Shanghai, recorded the largest fall at -59.3% and -45.2%, respectively.
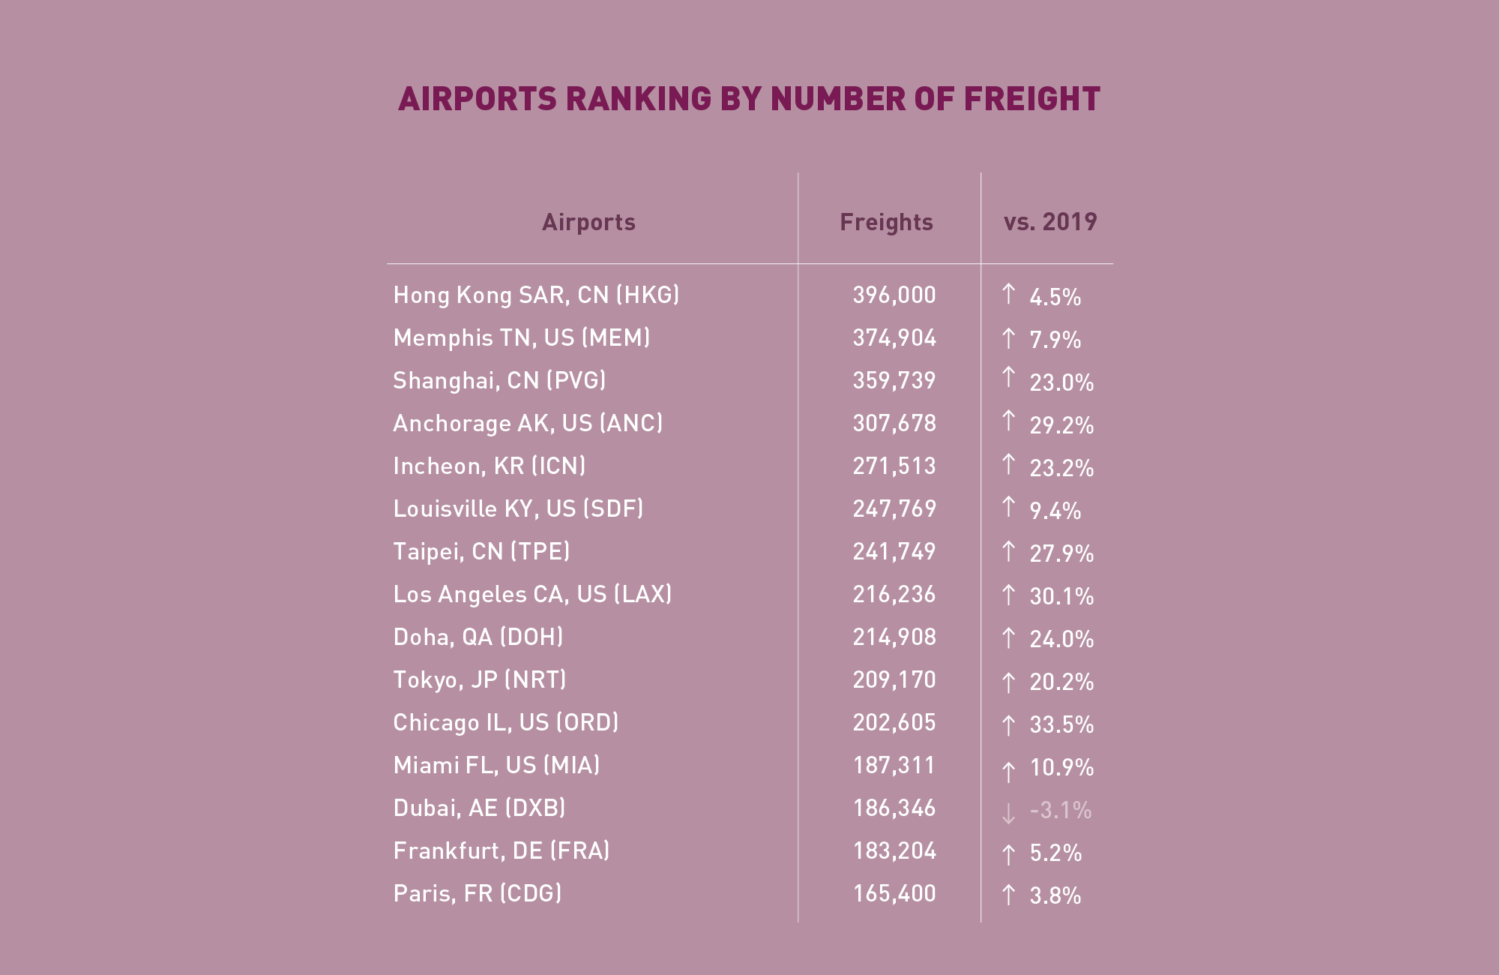
In terms of freight, the Top 15 airports reported an increase of +16.0%, compared to 2019. Dubai continued to be the only airport posting decline (-3.1%). With an increase of +4.5%, Hong Kong retained the 1st position followed by Memphis. With a robust +33.5%, Chicago recorded the strongest increase for the fifth time in a row.
Top 15 Airline Groups (Ranked by RPK)
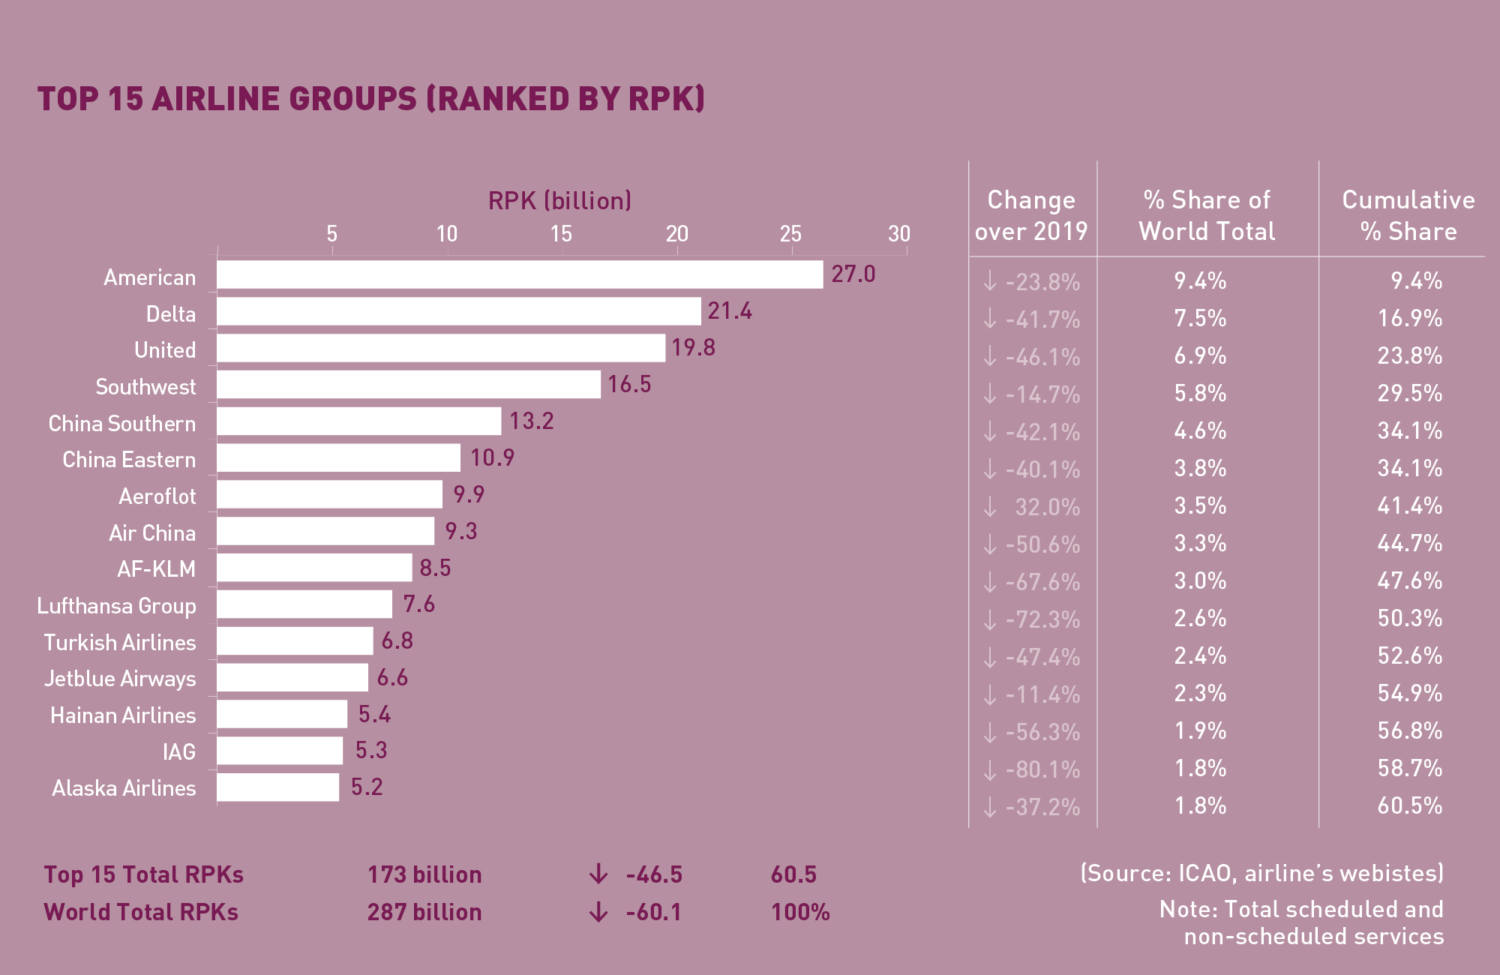
June 2021: -46.5% (vs. 2019) in terms of RPK for the Top 15
In terms of RPK, the Top 15 airline groups accounted for 60.5% of the world’s total RPK in June 2021 and declined by –46.5% compared to 2019. This decline was 13.6 percentage points smaller than the fall in the world’s average RPK. Airlines with large domestic markets continued to lead the growth chart.
US airlines improved significantly and reclaimed the top positions. American maintained at 1st with a decline of -23.8% compared to 2019. Delta and United improved 1 position to 2nd and 3rd, albeit recovering at a slower pace than other US airlines in the Top 15. For the first time of the year, Southwest ranked 4th, 3 positions up from the previous month.
Due to the tightened travel restrictions, Chinese domestic travel demand fell drastically, reversing the positive recovery trend. As a result, the rankings of all Chinese airlines dropped. China Southern, China Eastern and Air China ranked down to 5th, 6th, and 8th, respectively.
Airlines in Europe started to pick up modestly as international restrictions remained strict despite the rapid vaccine rollouts. The three major airline groups, AF-KLM, Lufthansa, and IAG recorded the largest contractions among the Top 15. Aeroflot and Turkish Airlines showed better performance owing to their domestic demand.
No airlines from the other regions, i.e. Africa, the Middle East, and Latin America/Caribbean, ranked in the Top 15.
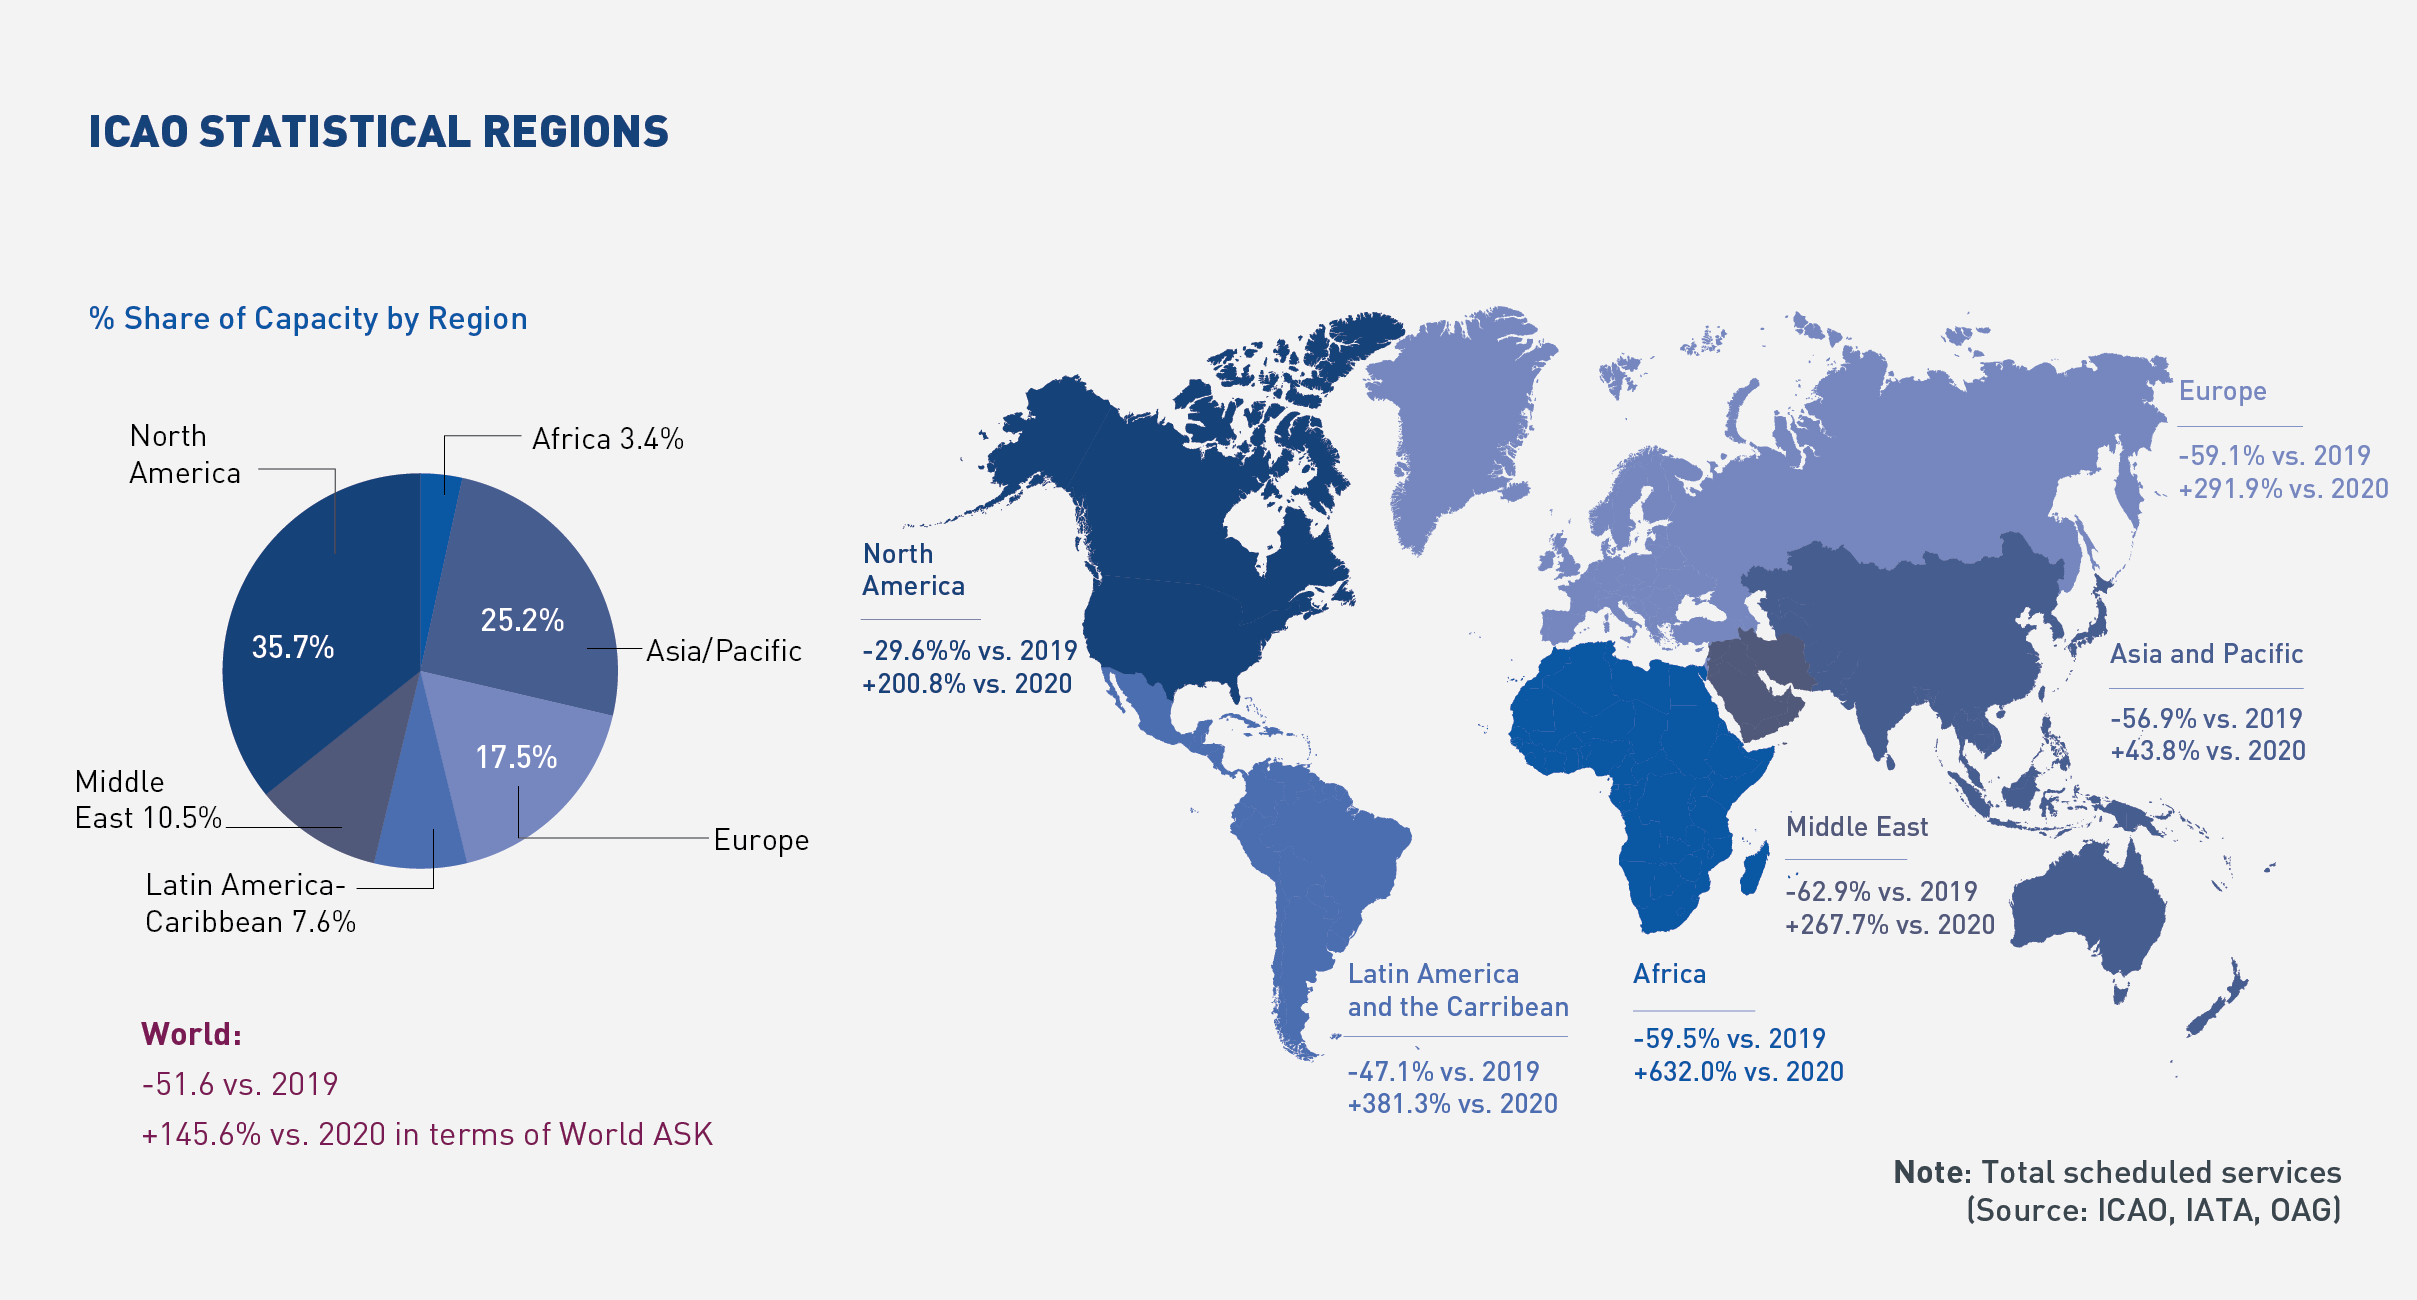
Worldwide capacity contracted by -51.6% in June 2021, compared to 2019. All regions saw improvements in capacity compared to the previous month, except for Asia/Pacific and the Middle East. The fastest capacity recovery was recorded in North America, whereas the slowest pace was in the Middle East. For the first half of 2021, capacity has recovered to -56.4% below the 2019 levels.
Click here to download the Monthly Monitor August PDF version.
For any queries for further information, please contact the ICAO Economic Development (ECD), Air Transport Bureau ecd@icao.int
Acronyms: ACI: Airports Council International; ASK: Available Seat-Kilometres; IATA: International Air Transport Association; FTK: Freight Tonne-Kilometres; LF: Passenger Load Factor; OAG: Official Airline Guide; RPK: Revenue Passenger-Kilometres; UNWTO: World Tourism Organization; YoY: Year-on-year; YTD: Year-to-date.