The air transport industry is not only a vital engine of global socio-economic growth, but it is also of vital importance as a catalyst for economic development. Not only does the industry create direct and indirect employment and support tourism and local businesses, but it also stimulates foreign investment and international trade.
Informed decision-making is the foundation upon which successful businesses are built. In a fast-growing industry like aviation, planners and investors require the most comprehensive, up-to-date, and reliable data. ICAO’s aviation data/statistics programme provides accurate, reliable and consistent aviation data so that States, international organizations, the aviation industry, tourism and other stakeholders can:
- make better projections;
- control costs and risks;
- improve business valuations; and
- benchmark performance.
The UN recognized ICAO as the central agency responsible for the collection, analysis, publication, standardization, improvement and dissemination of statistics pertaining to civil aviation. Because of its status as a UN specialized agency, ICAO remains independent from outside influences and is committed to consistently offering comprehensive and objective data. Every month ICAO produces this Air Transport Monitor, a monthly snapshot and analysis of the economic and aviation indicators.
ECONOMIC DEVELOPMENT – April 2022
World Results and Analyses for February 2022
Total Scheduled Services (Domestic and International)
Passenger traffic
![]() Revenue Passenger-Kilometres – RPK
Revenue Passenger-Kilometres – RPK
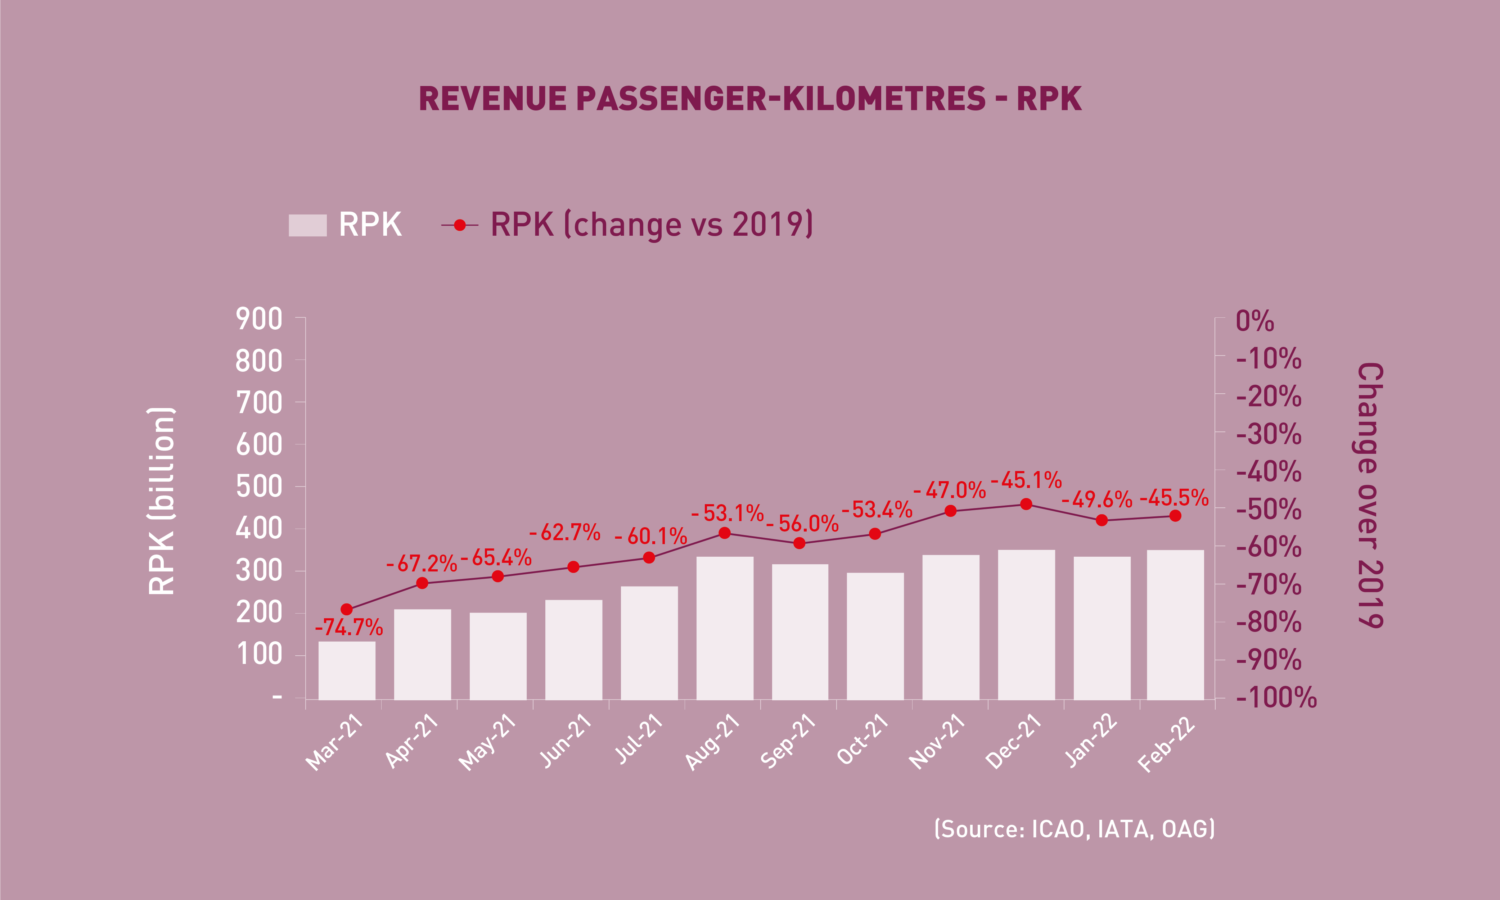
World passenger traffic fell by -45.5% in February 2022 (compared to 2019), +4.1 percentage points up from the decline in the previous month. Passenger traffic rebounded swiftly after trending sideways in January amid the proliferation of the Omicron variant. While the improvement in international air travel was broad-based, the performance of domestic travel was disparate across main markets. With signs of easing restrictions against Omicron, the positive recovery trend is likely to sustain in the following month.
![]() International Traffic vs. Tourist Arrivals
International Traffic vs. Tourist Arrivals
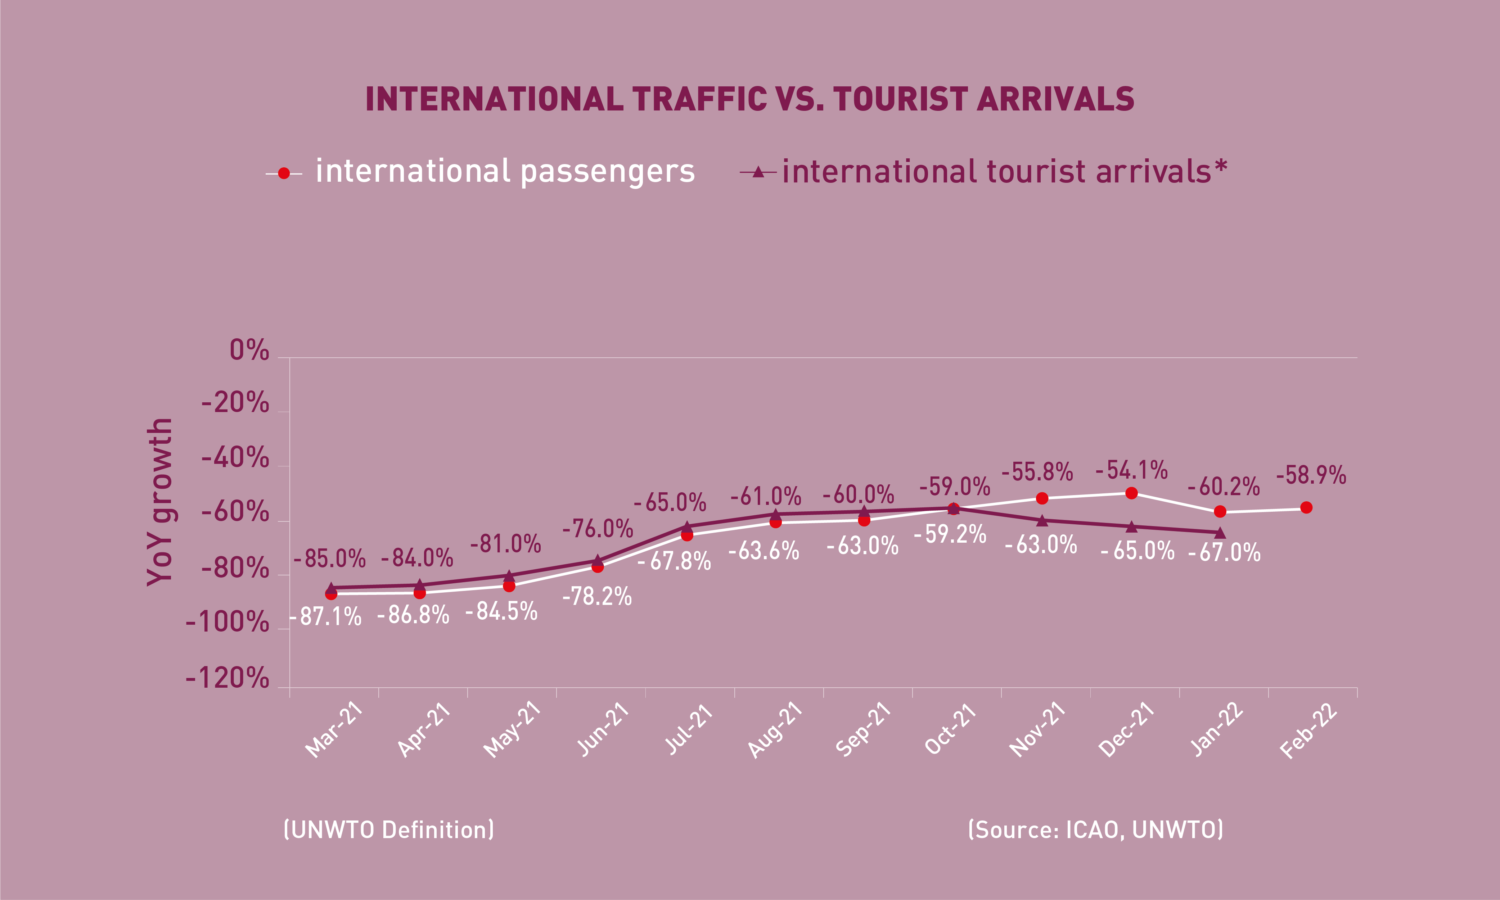
International passenger numbers fell by -58.9% in February 2022 (compared to 2019), +1.3 percentage points up from the decline in the previous month. All major regions, particularly Europe, demonstrated improvements. The recovery in international tourist arrivals is expected to follow a similar trend as international air travel.
Capacity
![]() Available Seat-Kilometres – ASK
Available Seat-Kilometres – ASK
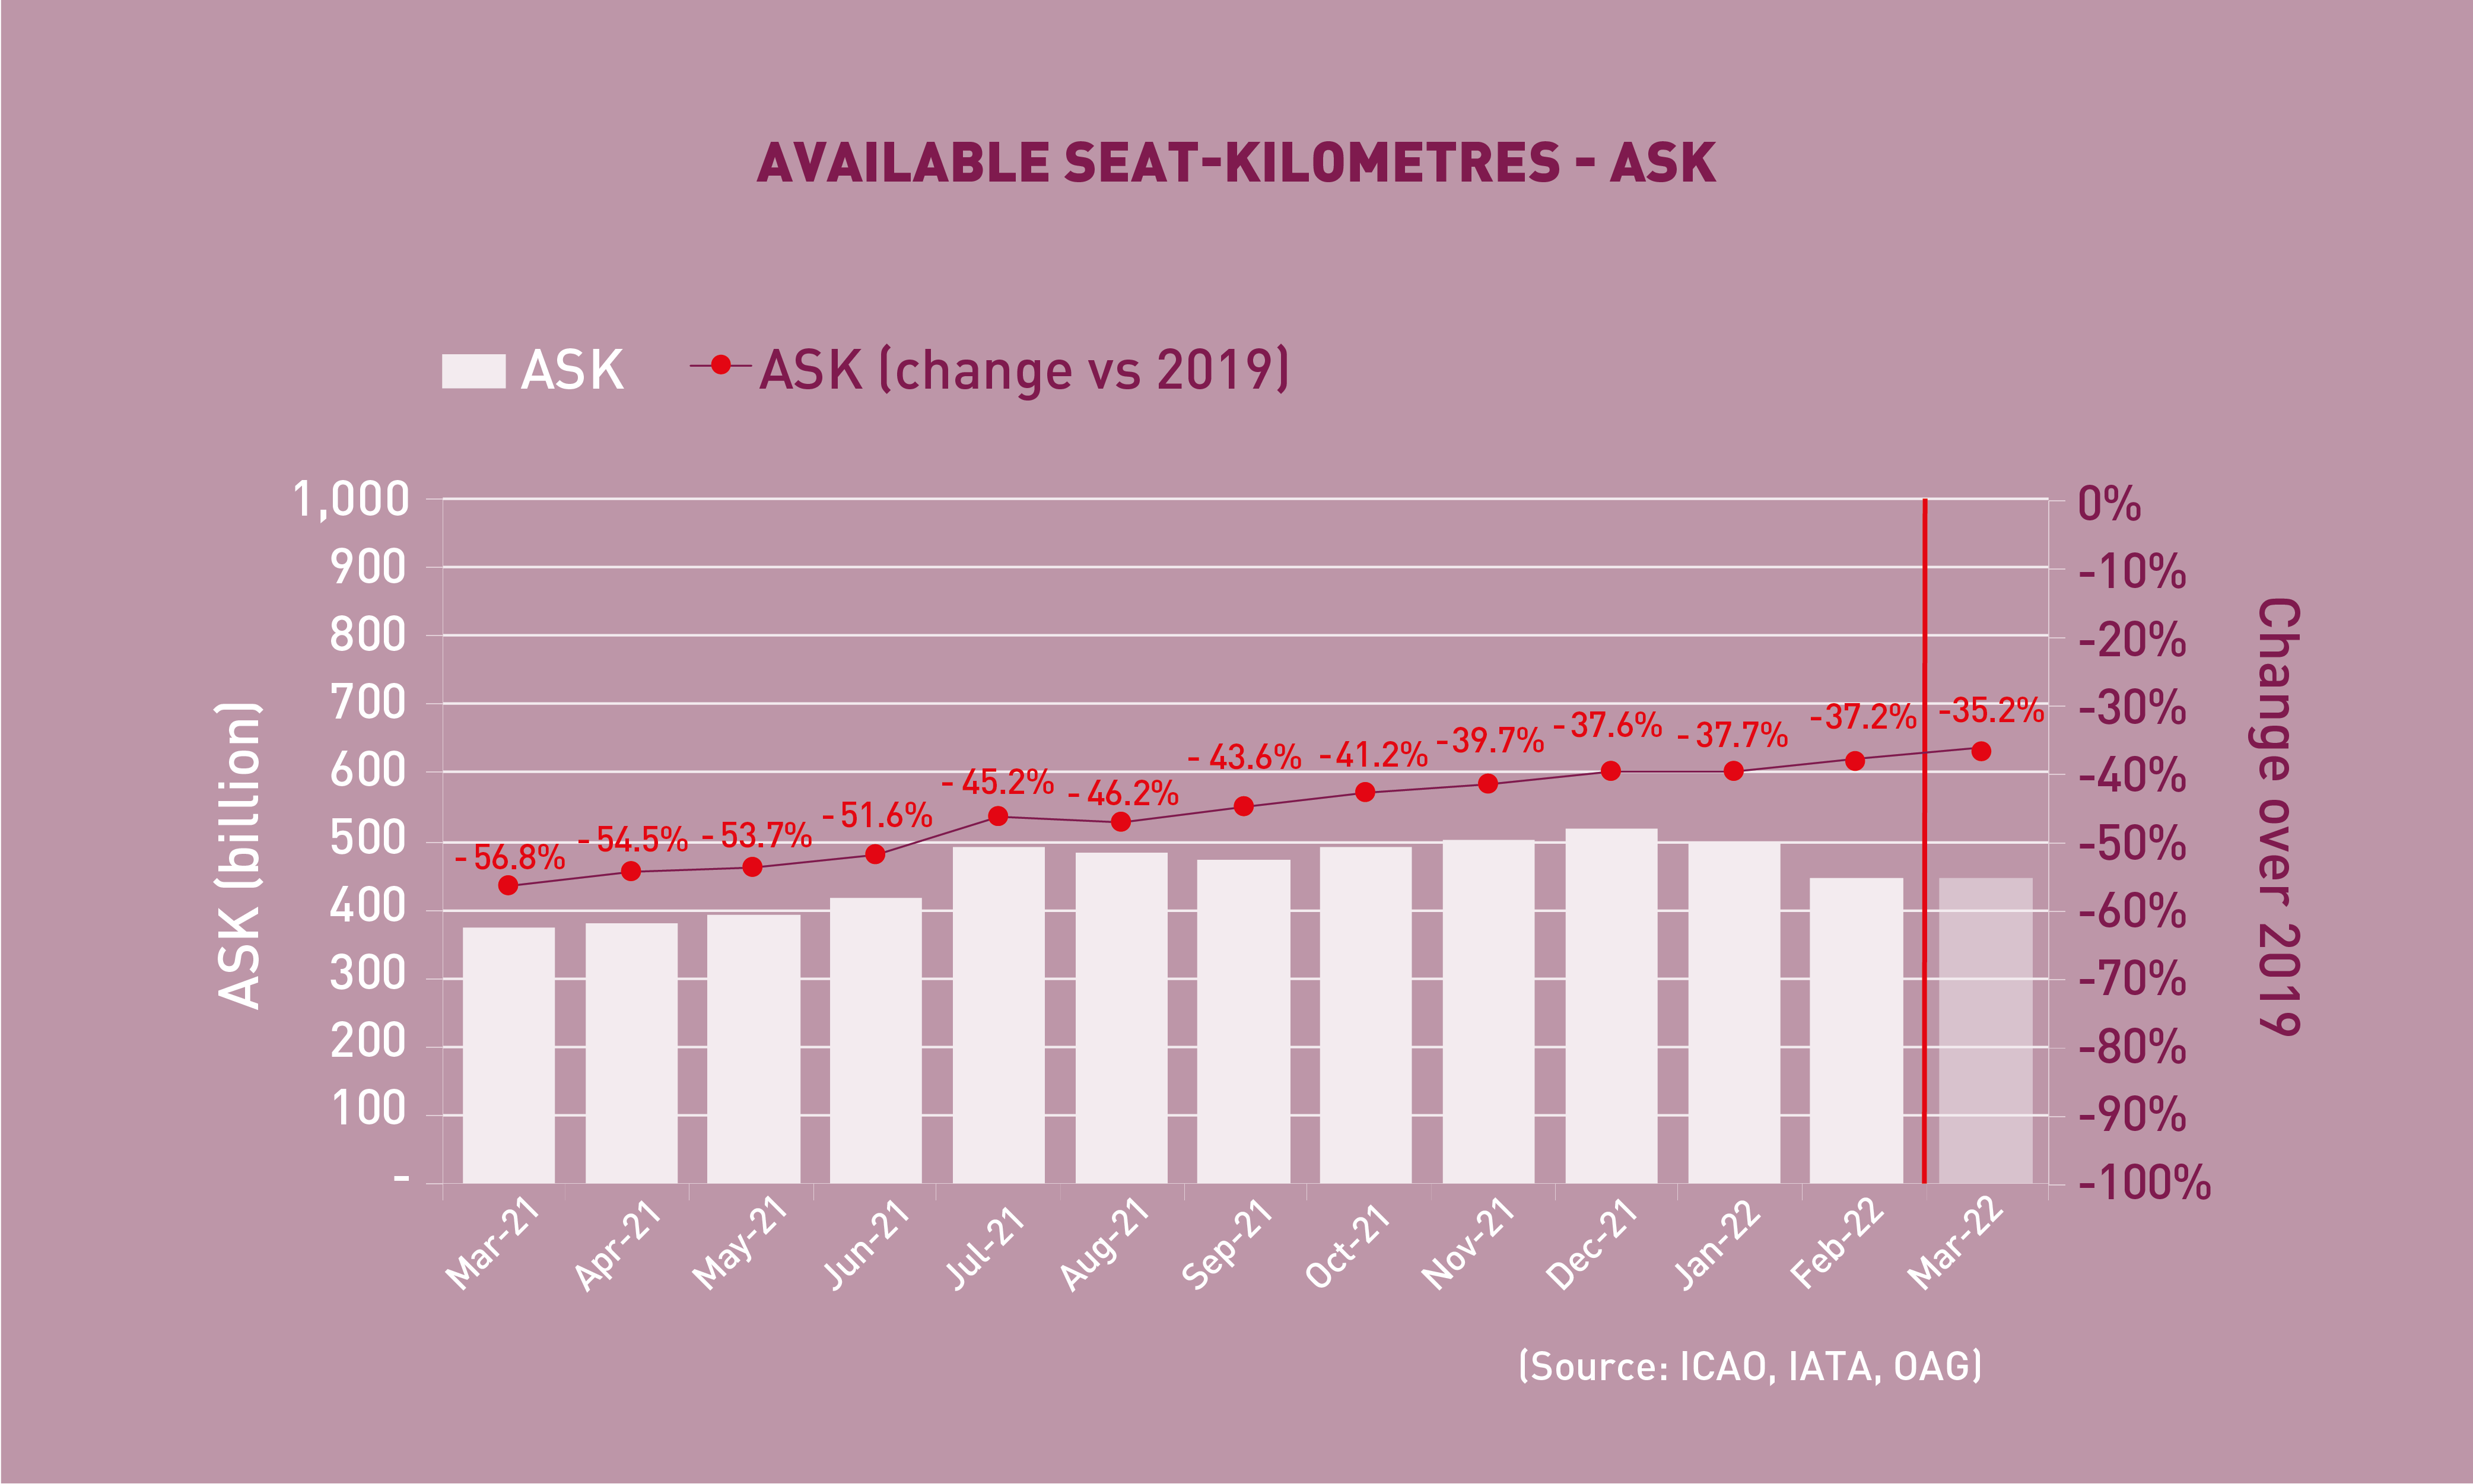
Capacity worldwide fell by -37.0% in February 2022 (compared to 2019), +0.7 percentage point down from the decline in the previous month (-37.7%). As Omicron related restrictions are being relaxed, the March capacity is expected to improve to –35.2% down from the 2019 level.
 Load Factor
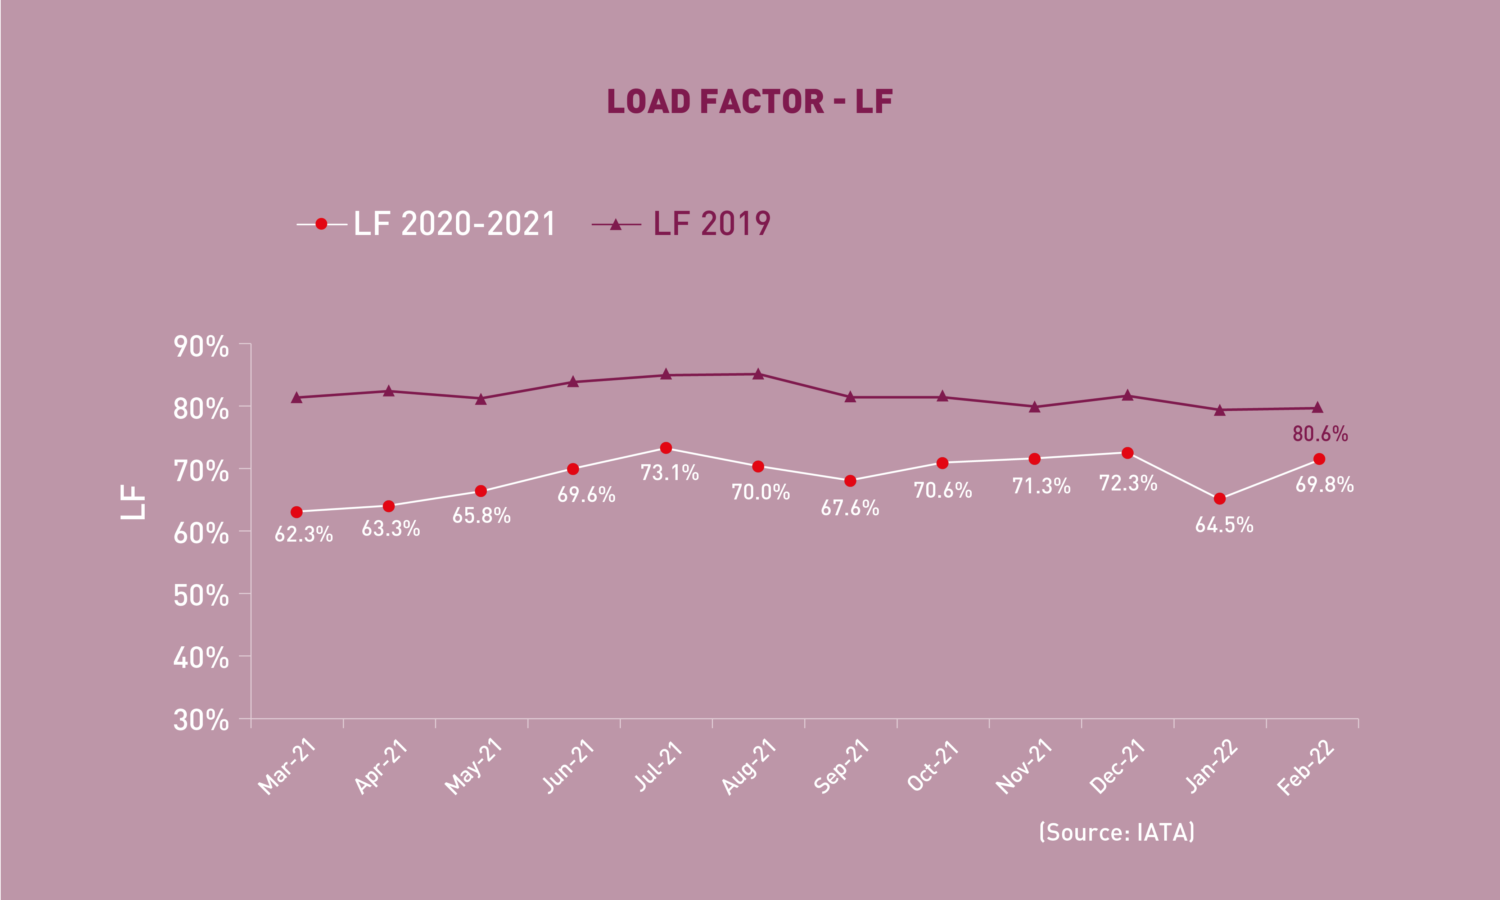
The passenger Load Factor reached 69.8% in February 2022, +5.3 percentage points higher than the previous month. Despite the improvement, the February LF remained -10.8 percentage points below the 2019 level.
Freight Traffic
![]() Freight Tonne-Kilometres – FTK
Freight Tonne-Kilometres – FTK
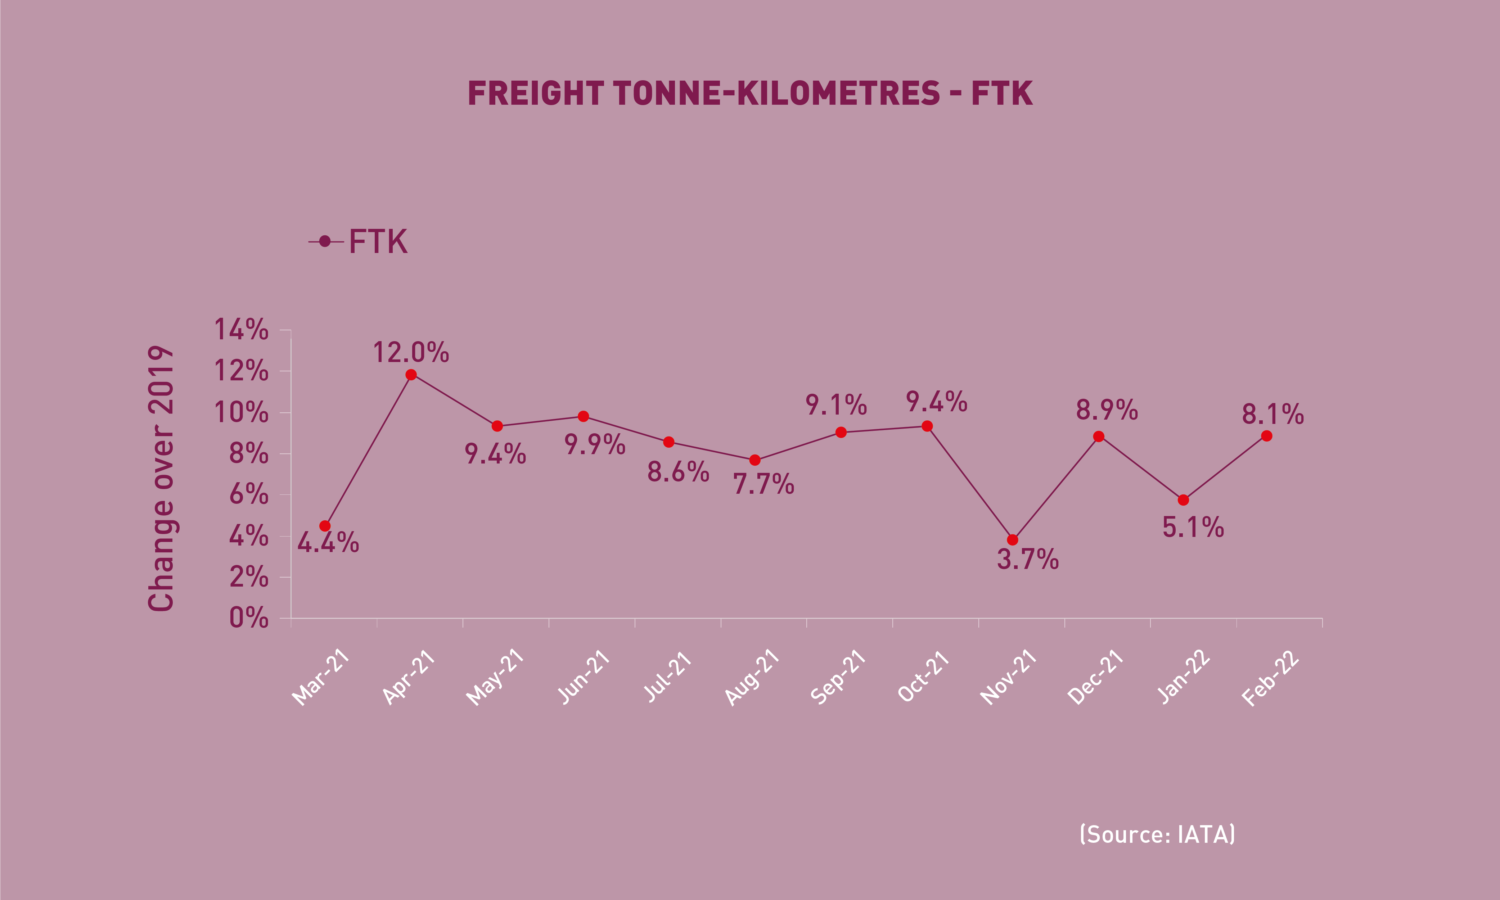
World freight traffic reported a growth of +8.1% in February 2022 (compared to 2019), +3.0 percentage points up from the growth in the previous month. Air cargo continued to grow, owing to the reduced disruptions from Omicron variant and the rebound in activity exports post Chinese New Year. Nevertheless, the current economic situation and the conflict in Ukraine points to challenges to future air cargo growth. Performance of the regions was a mix. Africa and North America were leading the growth chart with double-digit growth, while the increases for Asia/Pacific, Europe and the Middle East were moderate. Latin America/Caribbean remained the only region posting declines compared to 2019.
Top 15 Airports (Ranked by aircraft departures, passengers, and volume of freight)
Note: Figures include total scheduled and non-scheduled services
February 2022: 9.3%, -21.5%, and +17.3% (vs. 2019) in terms of aircraft departures, passengers and freight for the Top 15
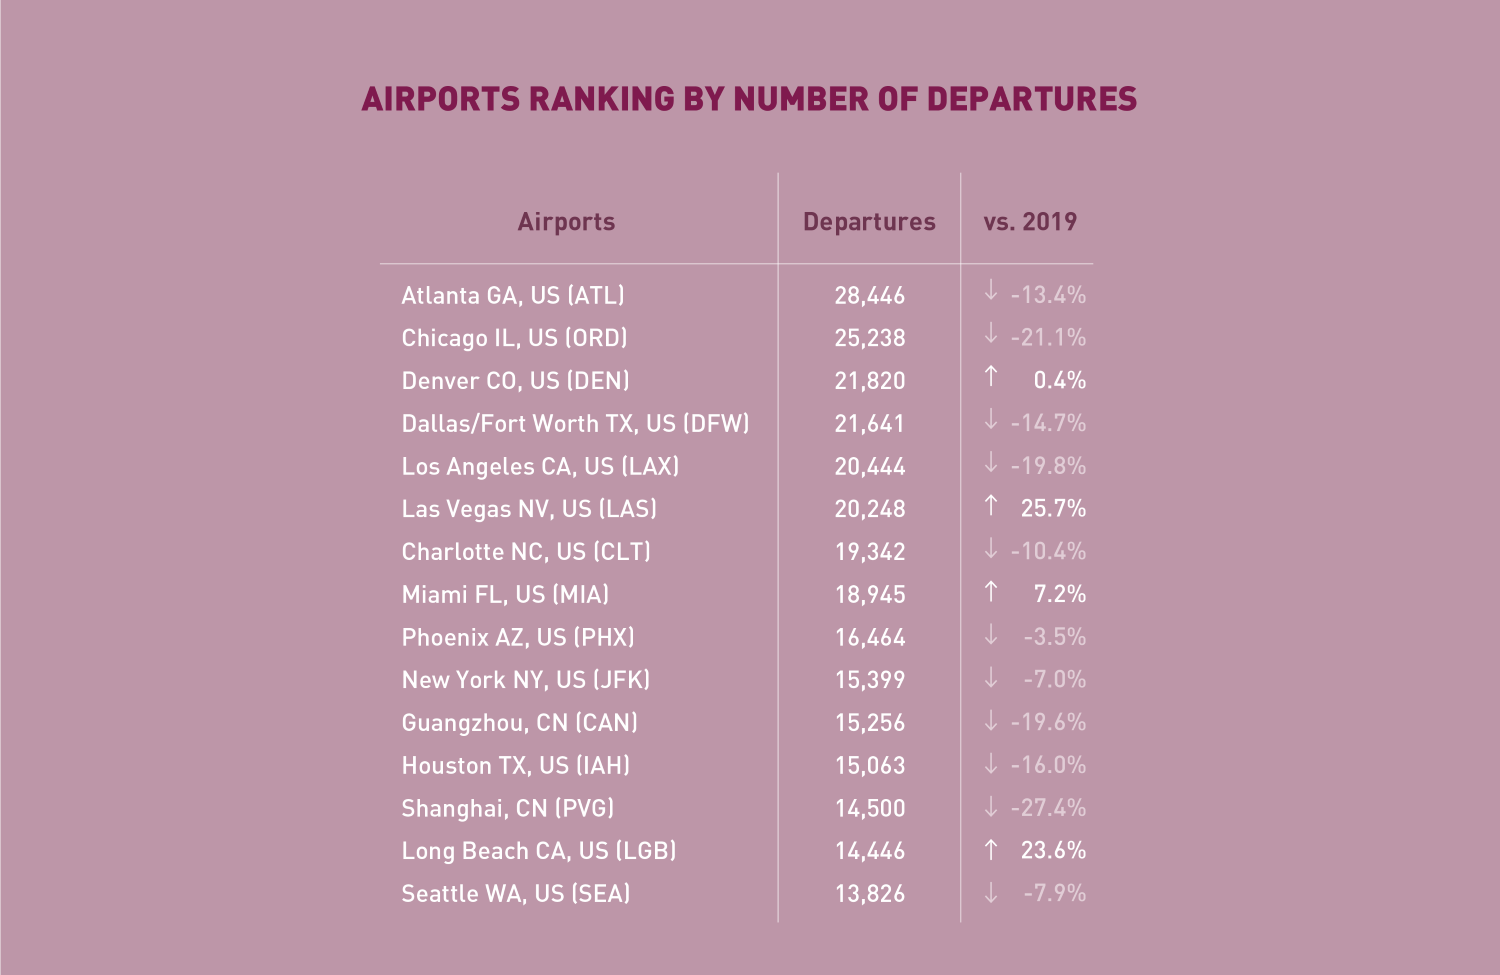
In terms of aircraft departures, the Top 15 airports reported a combined fall of -9.3%, compared to 2019. All but two of the Top 15 airports were US airports. Atlanta remained 1st with a decline of -13.4%. Four airports posted increases, i.e. Denver, Las Vegas, Miami and Long Beach. The two Chinese airports posted relatively large falls compared to the other Top 15.
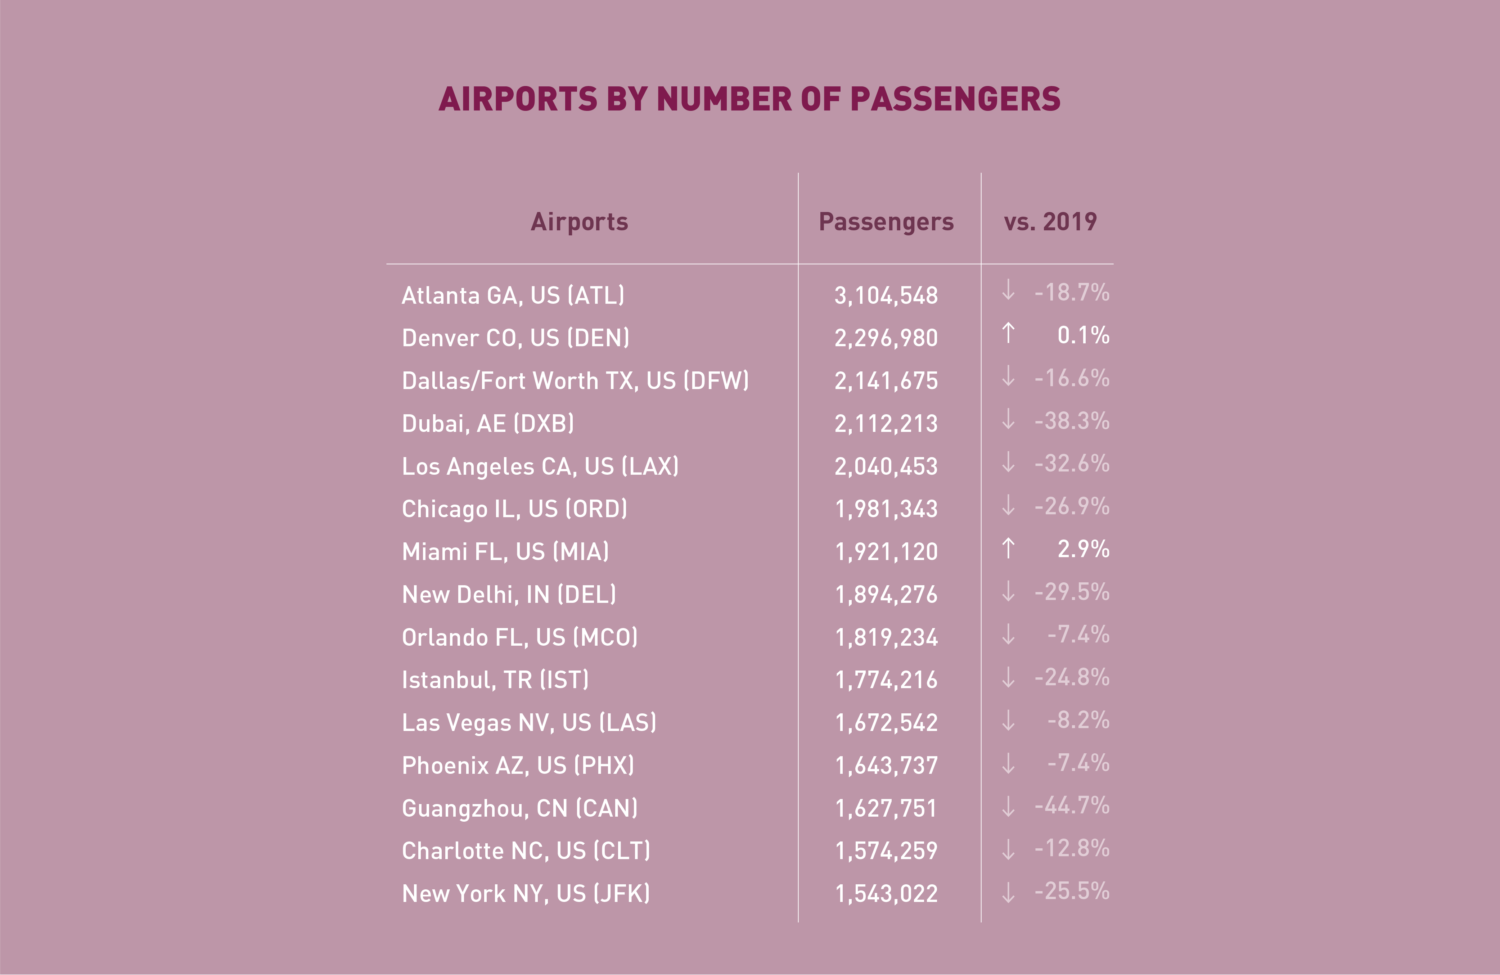
In terms of passengers, the Top 15 airports posted a total fall of -21.5%, compared to 2019. US airports continued to dominant the list, with 11 in the Top 15. Atlanta remained 1st with a decline of -18.7%. Guangzhou record the largest fall of -44.7%, followed by Dubai at -38.3%. On the positive side, two airports, i.e. Denver and Miami, posted growth over 2019.
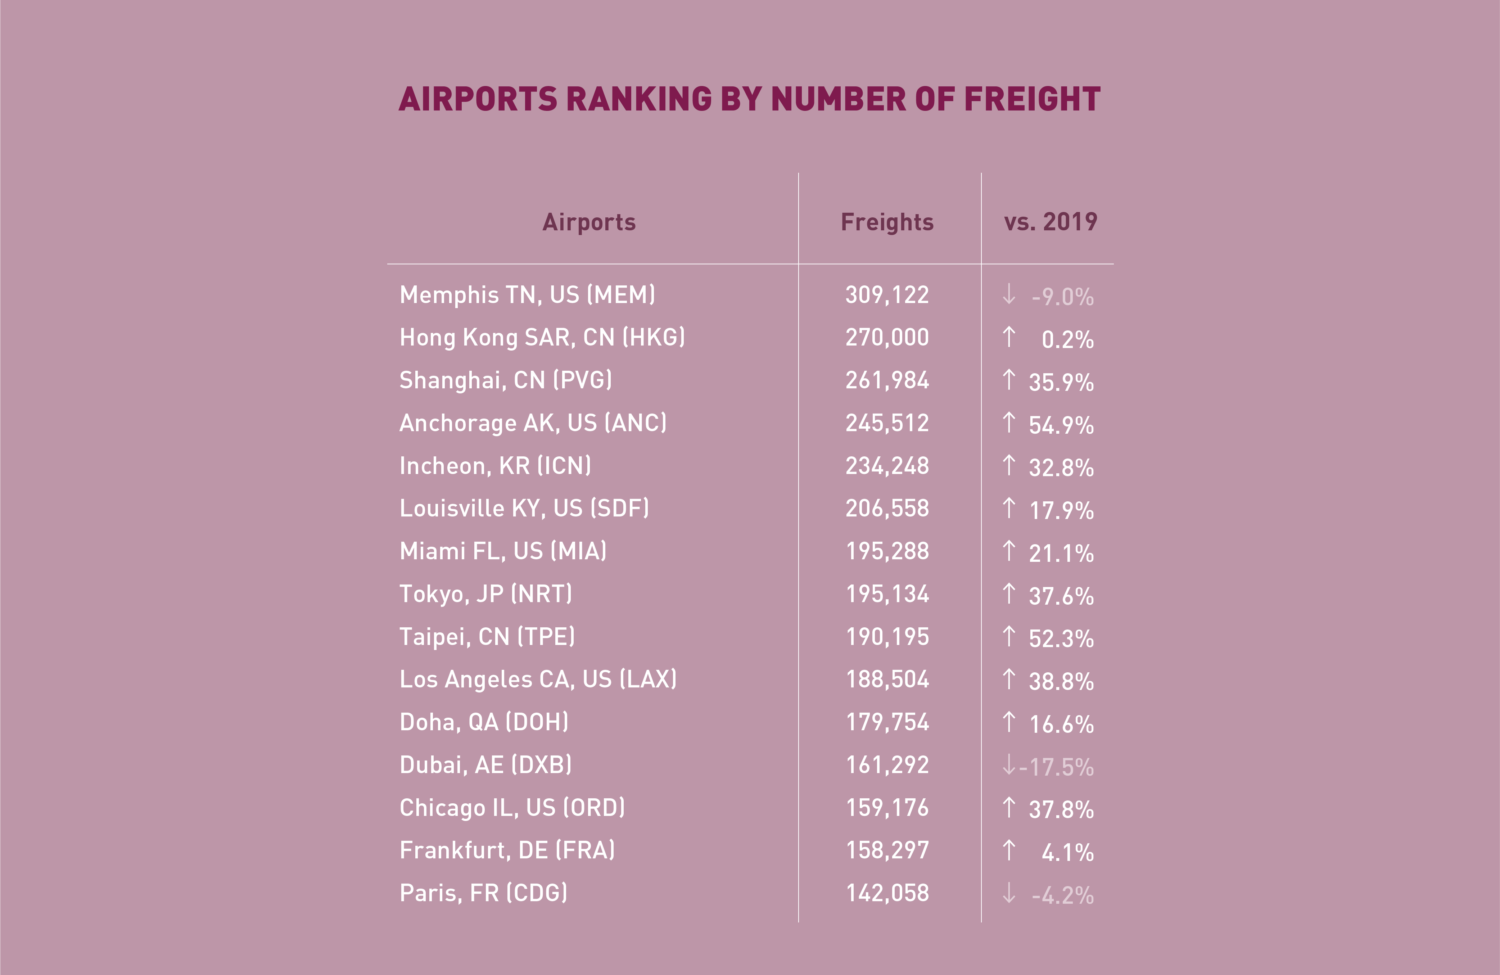 In terms of freight, the Top 15 airports reported an increase of +17.3%, compared to 2019. Majority of the Top 15 airports grew double-digitally, with Anchorage recording the strongest growth at a robust +54.9%. Despite the decline of -9.0%, Memphis overtook Hong Kong became 1st. For the six consecutive month, Dubai posted the largest fall.
Top 15 Airline Groups (Ranked by RPK)
February 2022: –37.5% (vs. 2019) in terms of RPK for the Top 15
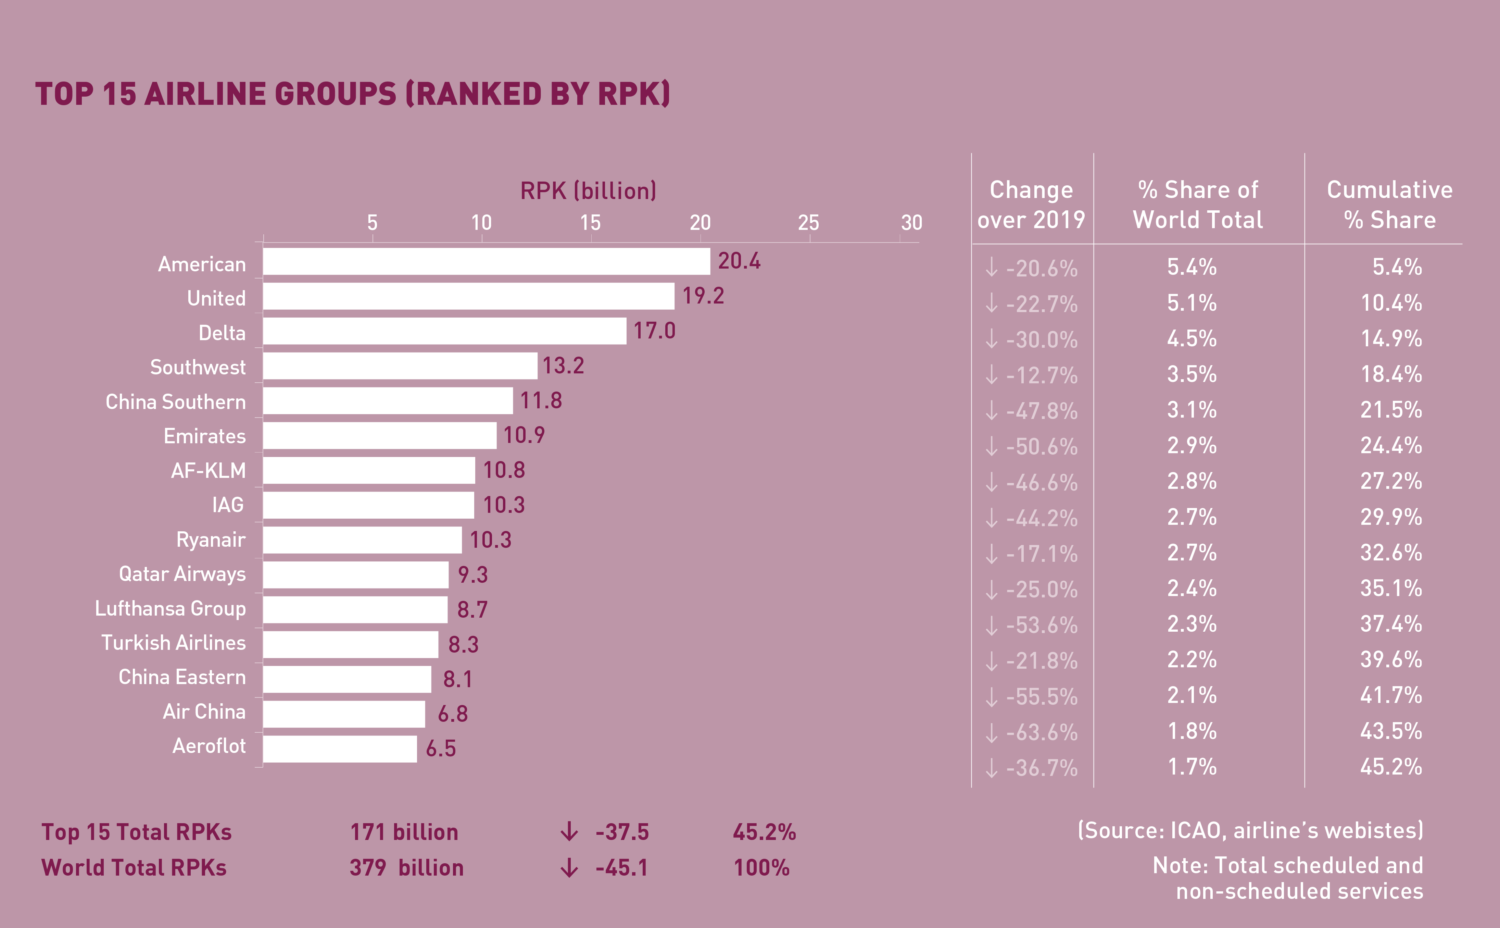
In terms of RPK, the Top 15 airline groups accounted for 45.2% of the world’s total RPK in February 2022 and declined by –37.5% compared to 2019. This decline was 7.6 percentage points smaller than the fall in world’s average RPK. February rankings fluctuated, particularly amongst the European airlines.
The U.S. airlines retained the Top 4 positions, with American at 1st, followed by United, Delta and Southwest. All of the four airlines also posted smaller declines compared to December 2021.
The Chinese domestic traffic improved slightly due to the timing of the Chinese New Year. As a result, Air China re-appeared in the Top 15 at 14th. China Southern and China Eastern improved respectively 1 and 2 positions to 5th and 13th.
Rankings of the European airlines fluctuated notably, impacted by a combination of easing travel restrictions and the conflict in Ukraine. While AF-KLM and Lufthansa dropped 2 and 3 positions, IAG climbed 5 positions.
Performance of airlines in the Middle East was consistent, with Emirates and Qatar maintaining similar positions as the previous month.
Capacity by Region
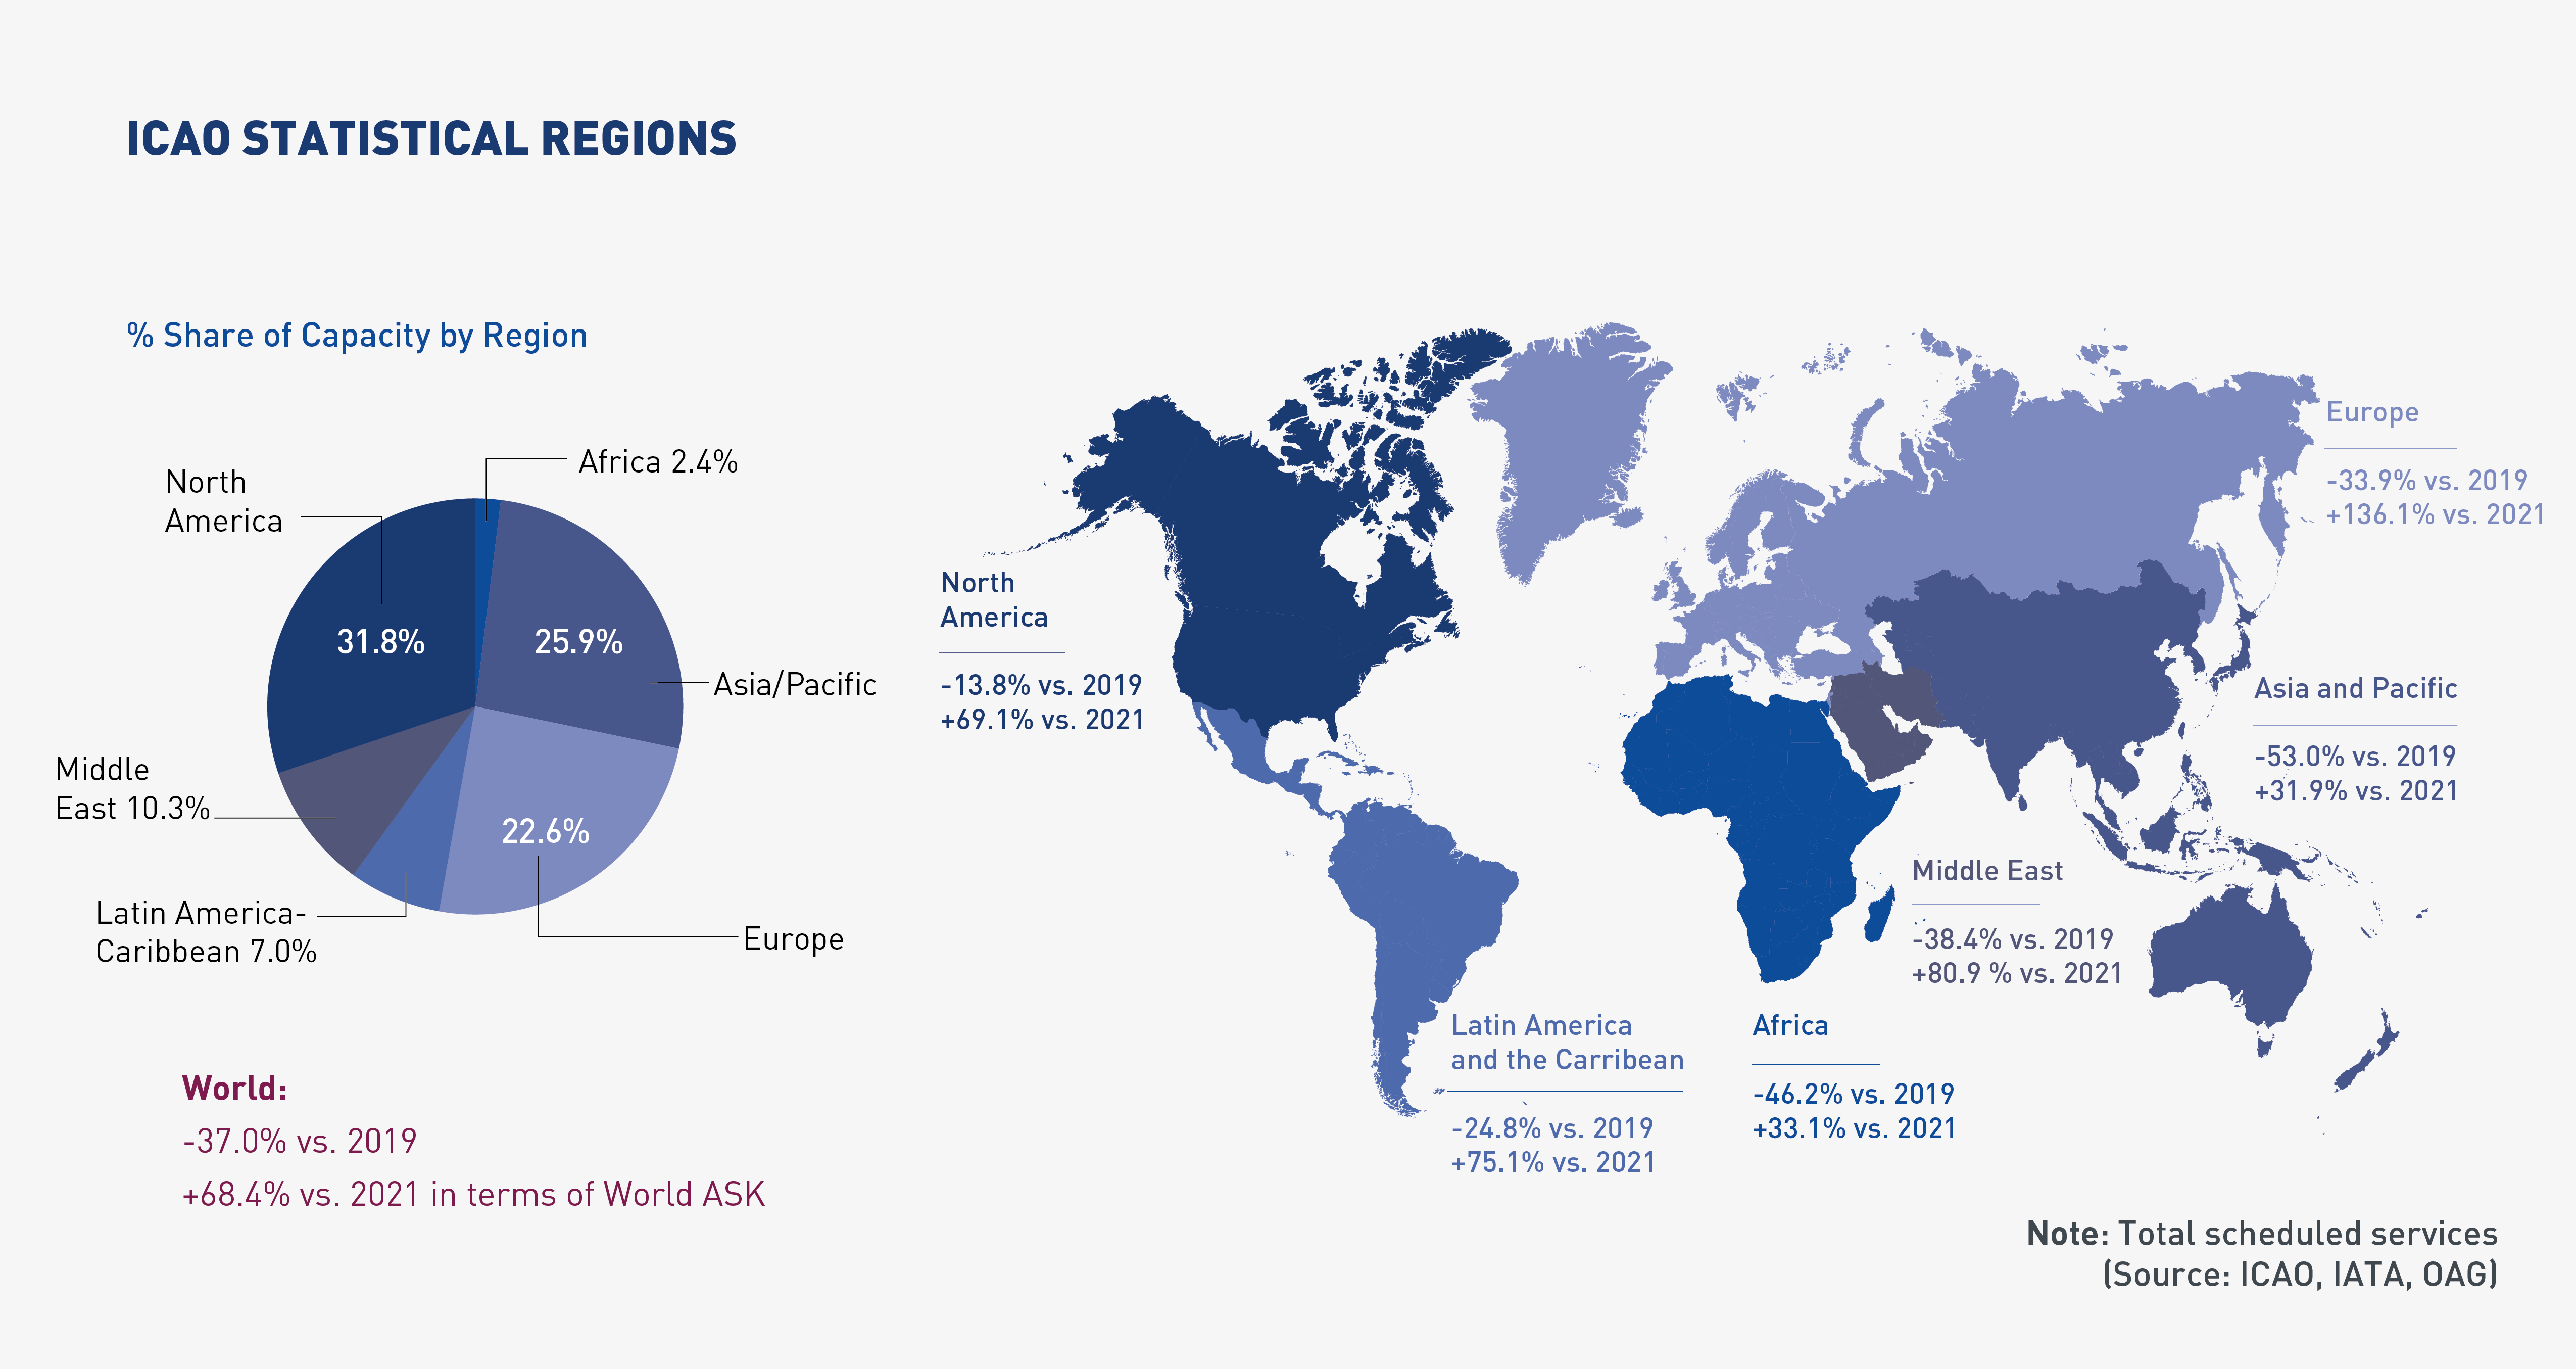
February 2022: -37.0% (vs. 2019) in terms of World ASK-37.2% (vs. 2019) in terms of World ASK
Worldwide capacity contracted by -37.0% in February 2022, compared to 2019. Following a marginal impact from the Omicron disruption in January, passenger capacity rebounded. North America demonstrated the most resilience with capacity close to the level saw pre-crisis. Asia/Pacific continued to be the slowest recovering region.
Click here to download the Monthly Monitor in a PDF version.
For any queries for further information, please contact the ICAO Economic Development (ECD), Air Transport Bureau ecd@icao.int
Acronyms: ACI: Airports Council International; ASK: Available Seat-Kilometres; IATA: International Air Transport Association; FTK: Freight Tonne-Kilometres; LF: Passenger Load Factor; OAG: Official Airline Guide; RPK: Revenue Passenger-Kilometres; UNWTO: World Tourism Organization; YoY: Year-on-year; YTD: Year-to-date.