
The air transport industry is not only a vital engine of global socio-economic growth, but it is also of vital importance as a catalyst for economic development. Not only does the industry create direct and indirect employment and support tourism and local businesses, but it also stimulates foreign investment and international trade.
Informed decision-making is the foundation upon which successful businesses are built. In a fast-growing industry like aviation, planners and investors require the most comprehensive, up-to-date, and reliable data. ICAO’s aviation data/statistics programme provides accurate, reliable and consistent aviation data so that States, international organizations, aviation industry, tourism and other stakeholders can:
-
- make better projections;
- control costs and risks;
- improve business valuations; and
- benchmark performance.
The UN recognized ICAO as the central agency responsible for the collection, analysis, publication, standardization, improvement and dissemination of statistics pertaining to civil aviation. Because of its status as a UN specialized agency, ICAO remains independent from outside influences and is committed to consistently offering comprehensive and objective data. Every month ICAO produces this Air Transport Monitor, a monthly snapshot and analysis of the economic and aviation indicators.
ECONOMIC DEVELOPMENT – NOVEMBER 2018
World Results and Analyses for September 2018
Total Scheduled Services (Domestic and International)
![]()
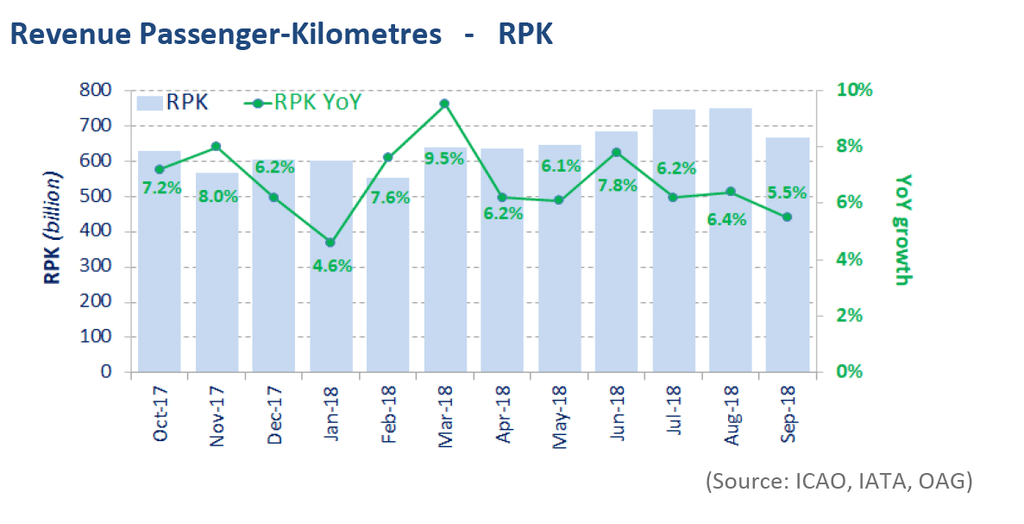
World passenger traffic grew by +5.5% YoY in September 2018, -0.9 percentage point down from the growth in the previous month. This growth was the slowest in the last eight months, impacted by the flight disruptions due to the typhoon in Asia/Pacific and weaker performance in the Middle East. On the positive side, Latin America/Caribbean and North America recorded slight acceleration. India’s domestic travel demand remained strong and recorded the fastest growth followed by China and the Russian Federation.
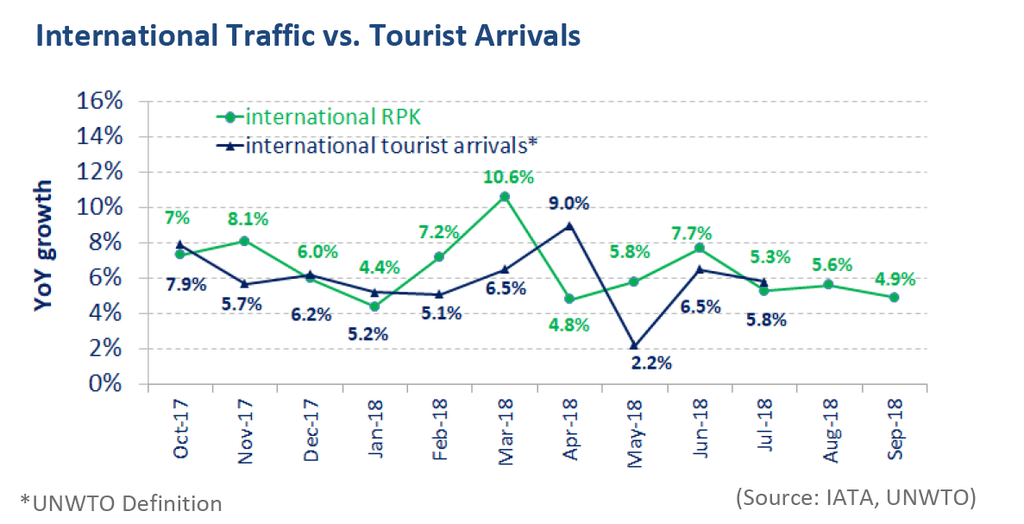
International passenger traffic grew by +4.9% YoY in September 2018, -0.7 percentage point lower than the growth in the previous month. The Performance by the region is similar to the total passenger traffic. The growth of international tourist arrivals* is expected to follow a similar monthly trend.
![]()

Capacity worldwide increased by +5.8% YoY in September 2018, +0.3 percentage point higher than the growth in the previous month (+5.5%). In response to the passenger traffic demand, the expansion of capacity is expected to be at +6.1% in October 2018.
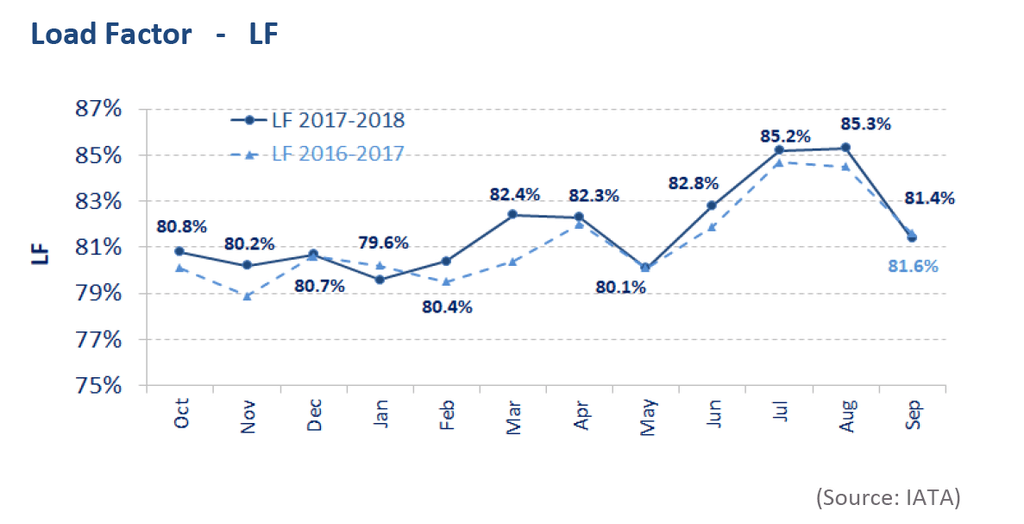
The passenger Load Factor reached 81.4% in September 2018, -3.9 percentage points lower than the LF recorded in the previous month. As capacity expansion outpaced the traffic growth, the September LF was -0.2 percentage point lower than the rate in the same period in 2017.

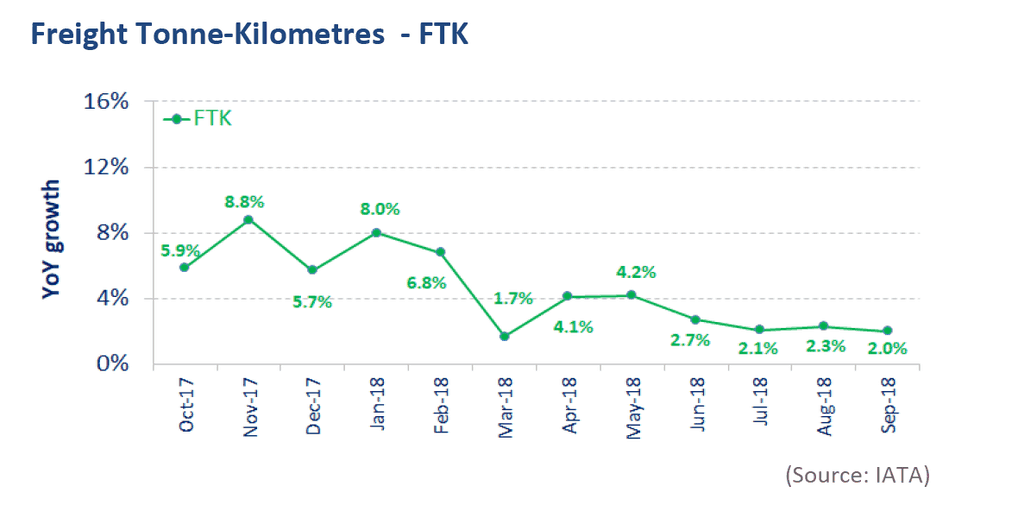
World freight traffic grew by +2.0% YoY in September 2018, -0.3 percentage point lower than the growth in the previous month. This slowdown reflects an overall weakening in world trade. The three largest regions of freight traffic, Asia/Pacific, Europe and North America, posted a deceleration with subdued growth of less than +2.0%, impacted by the recent trade tension. The Middle East recorded the highest growth among all regions, helped by improvements in the key markets to/from Europe and Asia. A slight improvement was also observed in Africa; however, the region remained as the only one with negative growth for the fifth consecutive month, reflecting weaker demand to/from the region.
![]()
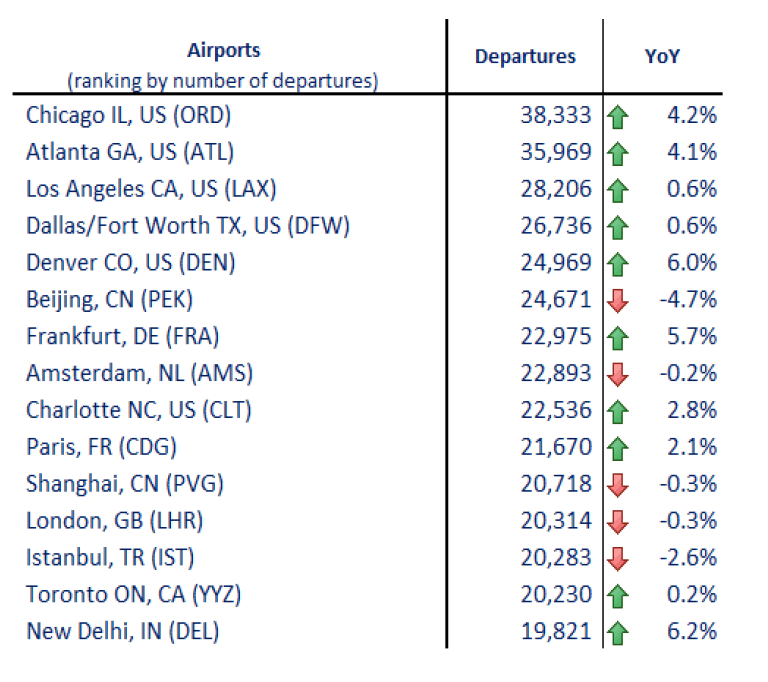
In terms of aircraft departures, the Top 15 airports reported a growth of +1.7% YoY. Ten out of the Top 15 airports posted YoY increases. The strongest growth in operations was recorded by New Delhi at +6.2%, owing to its strong domestic travel. Beijing and Istanbul posted a decline of -4.7% and -2.6%, respectively.
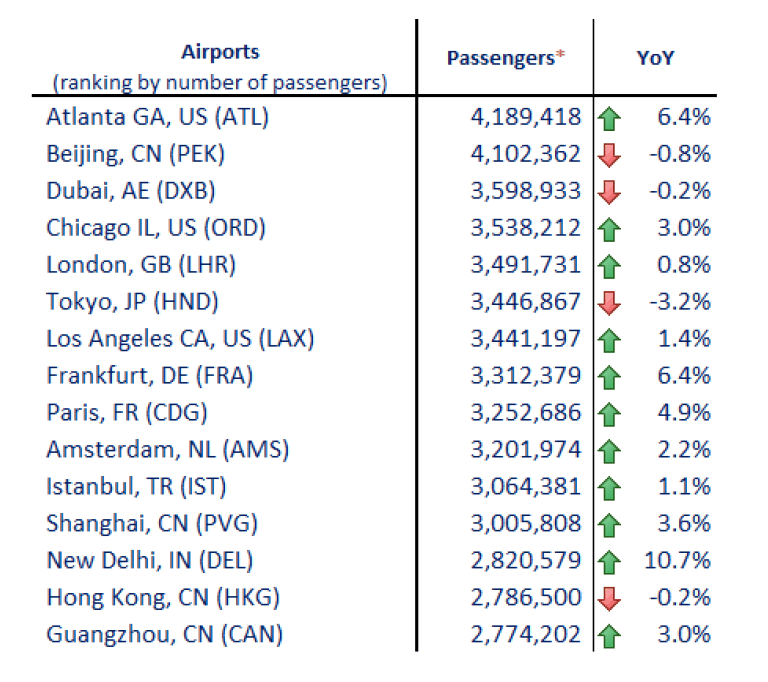
In terms of passengers, the Top 15 airports reported a growth of +2.4% YoY. Eleven out of the Top 15 airports posted YoY increases. Tokyo reported a significant decline at -3.2% due to the severe weather conditions. New Delhi recorded the fastest growth in passenger traffic by +10.7%, followed by Atlanta and Frankfurt, both at +6.4%.
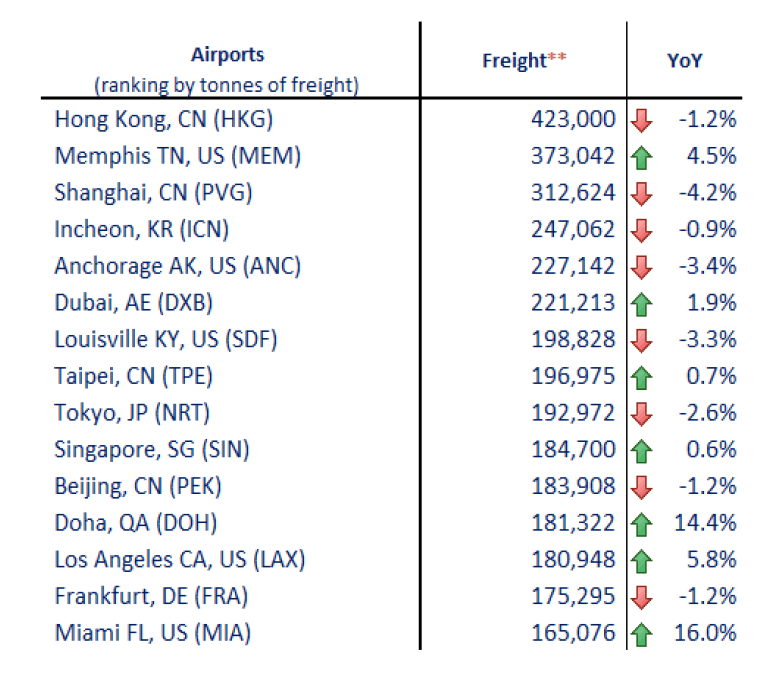
In terms of freight, the top 15 airports reported a growth of +1.0%. Only seven out of the Top 15 reported a growth. The strongest growth was recorded by Miami FL at +16.0%, and Doha +14.4%. Shanghai posted the biggest decline of –4.2%, due to weaker conditions for manufacturing exporters in Asia/Pacific.
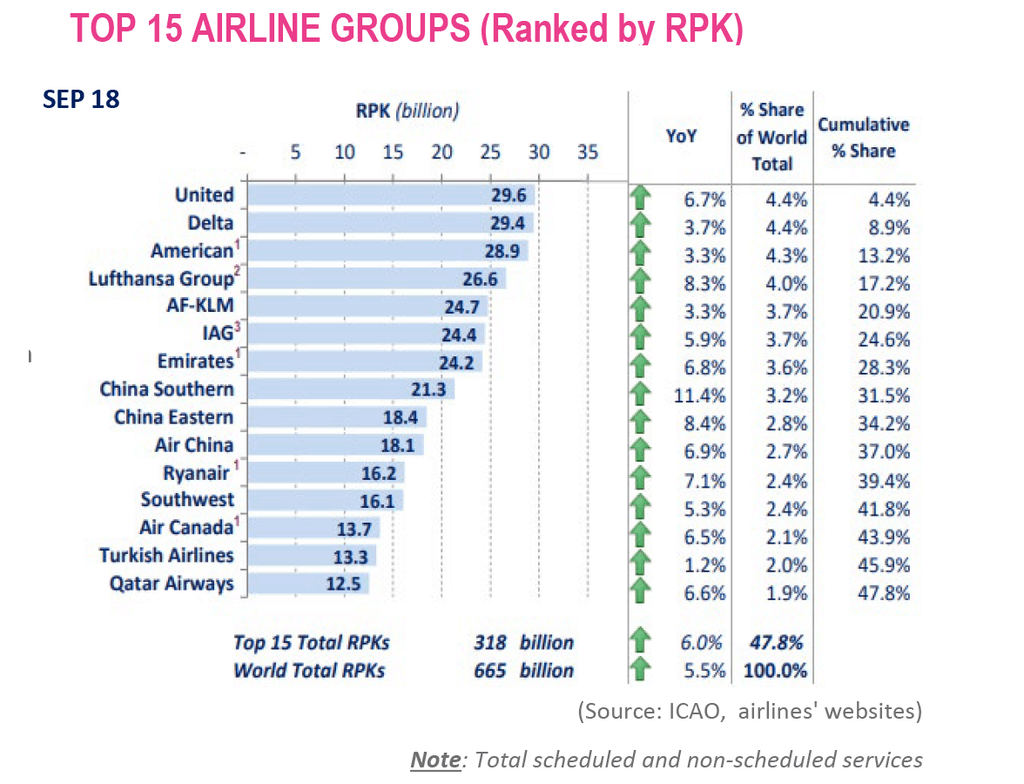
In terms of RPK, the Top 15 airline groups accounted for 47.8% of world total RPK in September 2018 and grew by +6.0% YoY. This growth was +0.5 percentage point higher than the world average on scheduled services. All the Top 15 airline groups posted YoY increases.
United ranked 1st with a strong growth of +6.7%, competing strongly with Delta which grew at +3.7% while dropping by 1 position to the 2nd. American remained at 3rd with a growth of +3.3%. Southwest dropped by 2 positions to 12th and was up by +5.3%. Air Canada held its position at 13th with a growth of +6.5%.
Emirates posted a growth of 6.8% and remained 7th. Qatar Airways dropped by 1 position to 15th with a slowdown in growth at +6.6%.
Lufthansa posted a strong growth of +8.3% and remained at 4th, followed by AF-KLM and IAG position with slightly slower growth of +3.3% and 5.9%, respectively. Turkish Airlines ranked 1 position up to 14th albeit with the weakest growth among the Top 15 at +1.2%. Ryanair posted growth of +7.1% and ranked 1 position up to 11th.
Major airlines in Asia/Pacific continued to grow robustly, with China Southern recording the fastest growth by +11.4% and ranked 8th. China Eastern grew strongly by +8.4% and ranked 2 positions up to 9th. Air China grew by +6.9% and dropped by 1 position to 10th.
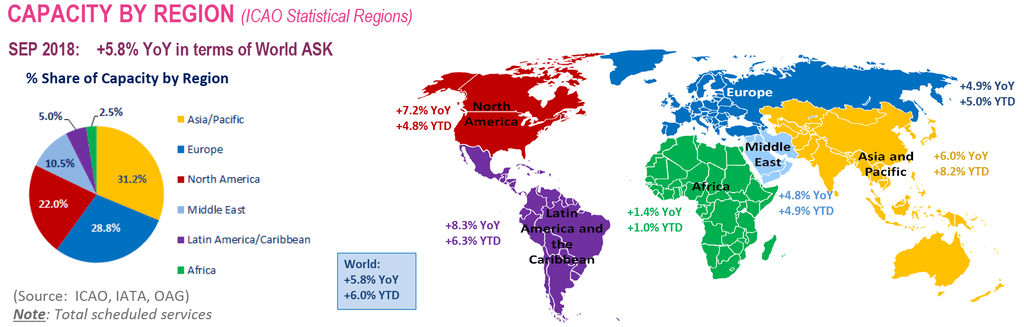
Worldwide capacity expanded by +5.8% YoY in September 2018. Latin America/Caribbean posted the fastest expansion followed by North America and Asia/Pacific. The other regions, Europe, the Middle East and Africa posted slower growth compared to world average.
Asia/Pacific and the Middle East experienced a deceleration in capacity increase compared to the previous month.