The air transport industry is not only a vital engine of global socio-economic growth, but it is also of vital importance as a catalyst for economic development. Not only does the industry create direct and indirect employment and support tourism and local businesses, but it also stimulates foreign investment and international trade.
Informed decision-making is the foundation upon which successful businesses are built. In a fast-growing industry like aviation, planners and investors require the most comprehensive, up-to-date, and reliable data. ICAO’s aviation data/statistics programme provides accurate, reliable and consistent aviation data so that States, international organizations, aviation industry, tourism and other stakeholders can:
- make better projections;
- control costs and risks;
- improve business valuations; and
- benchmark performance.
The UN recognized ICAO as the central agency responsible for the collection, analysis, publication, standardization, improvement and dissemination of statistics pertaining to civil aviation. Because of its status as a UN specialized agency, ICAO remains independent from outside influences and is committed to consistently offering comprehensive and objective data. Every month ICAO produces this Air Transport Monitor, a monthly snapshot and analysis of the economic and aviation indicators.
ECONOMIC DEVELOPMENT – March 2021
World Results and Analyses for January 2021
Total Scheduled Services (Domestic and International)
Passenger traffic
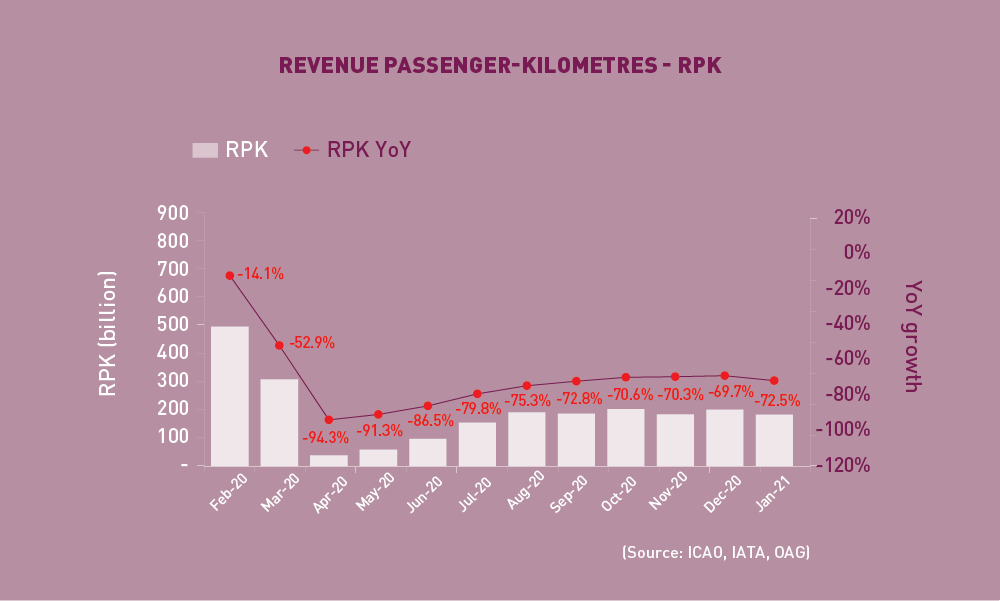
Revenue Passenger-Kilometres – RPK
World passenger traffic fell by -72.5% YoY in January 2021, -2.8 percentage points lower than the decline in the previous month. Entering into the new year, the pandemic intensified across the globe, with the emergence of more contagious virus variants and the imposition of stricter control measures. Consequently, 2021 started with a worsening decline in passenger traffic, the first deterioration since bottoming out from the lowest point of the crisis in April. Domestic traffic was mostly impacted, particularly in China where traffic plunged due to the tightened travel restrictions.
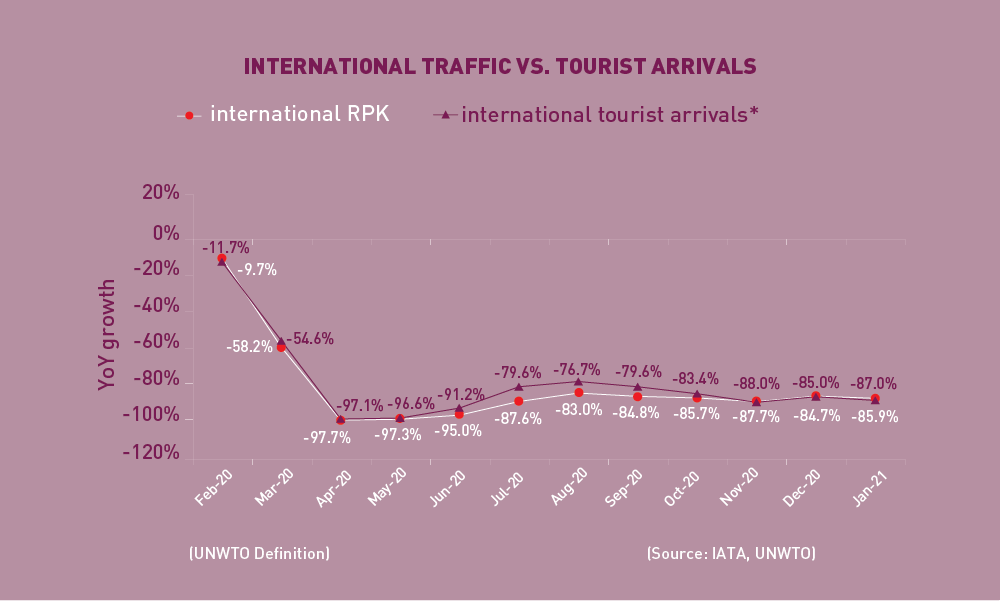
International Traffic vs. Tourist Arrivals
International passenger numbers fell by -85.9% YoY in January 2021, -1.2 percentage points down from the decline in the previous month. International traffic remained muted across all regions and further weakened, affected by the pandemic acceleration and new lockdowns.
The international tourist arrivals also remained stagnant and followed a similar trend as international passenger traffic.
Capacity
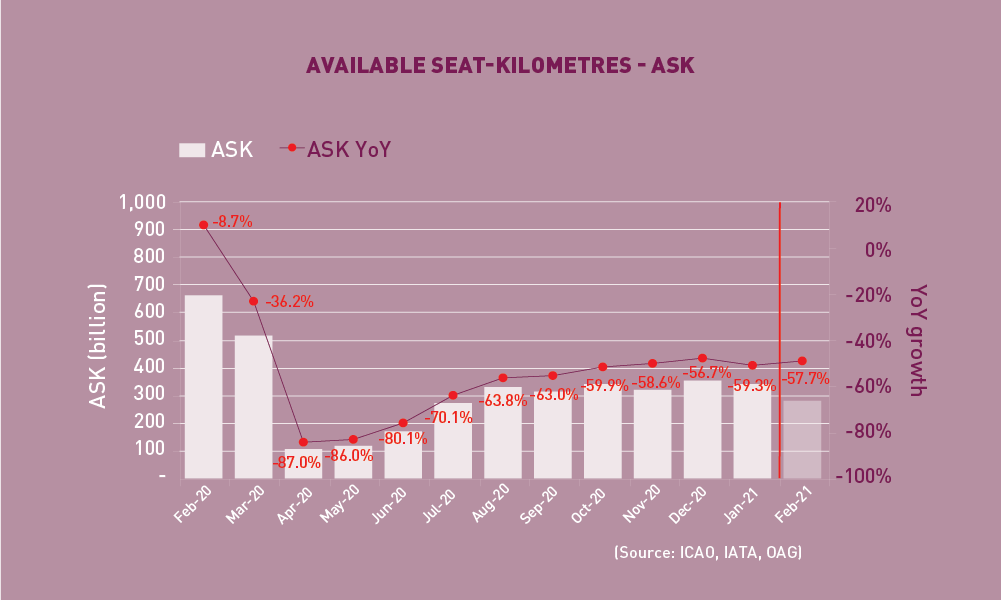
Available Seat-Kilometres – ASK
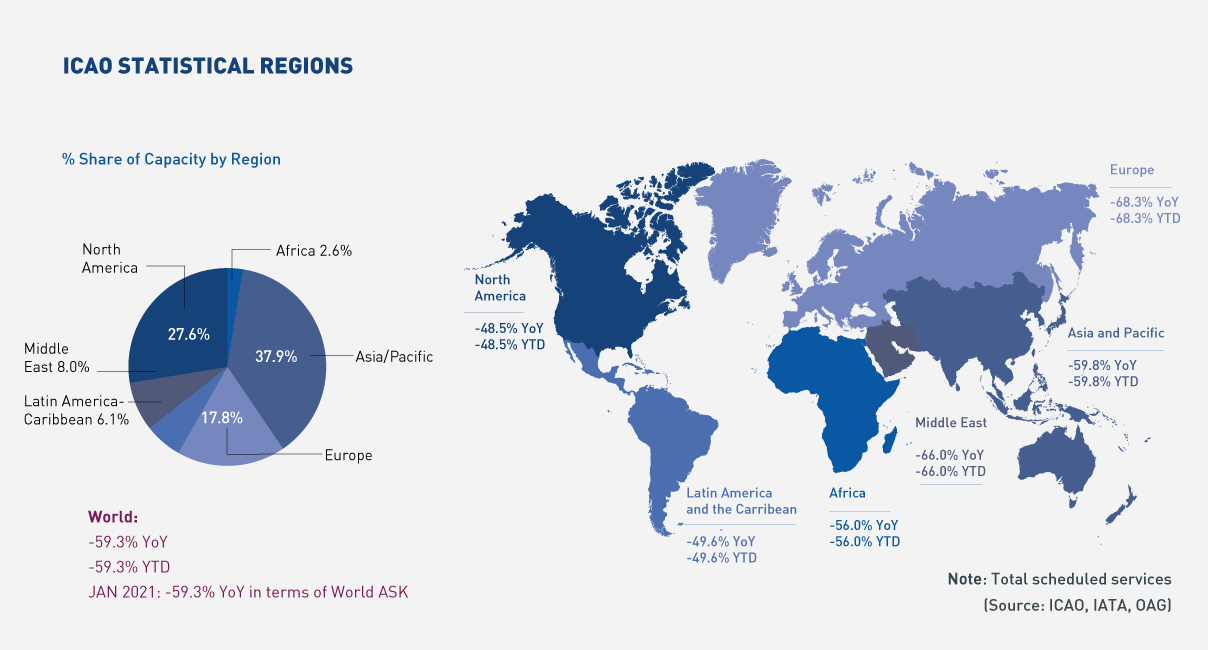
Capacity worldwide fell by -59.3% YoY in January 2021, -2.6 percentage points down from the decline in the previous month (-56.7%). Amid the surge of new COVID-19 cases and increasing travel restrictions, capacity is likely to stay at a similar level as in February 2021 with a decline of -57.7% YoY.
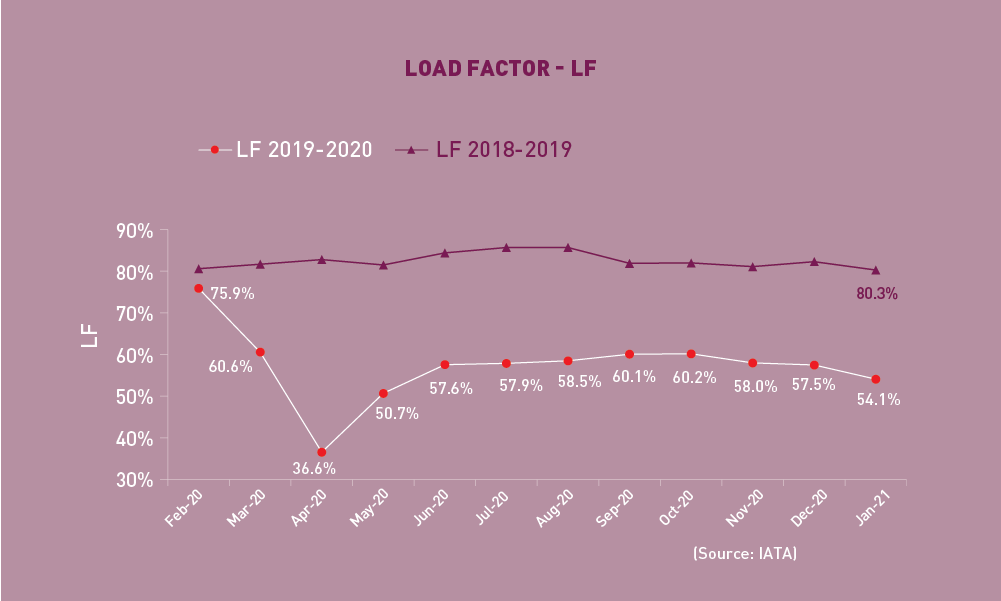
Load Factor
The passenger Load Factor reached 54.1% in January 2021, -3.4 percentage points lower than the previous month. As air travel demand fell faster than capacity, the January LF deteriorated to the lowest level since May 2020, and was -26.2 percentage points lower than the rate in the same period of 2020.
Freight Traffic
Freight Tonne-Kilometres – FTK
World freight traffic reported a growth of +6.1% YoY in January 2021, +6.6 percentage points up from the fall in the previous month. After experiencing 21-month of continuous YoY decline since April 2019, freight traffic finally saw positive growth and exceeded the 2019 levels. Despite the renewed outbreaks, air cargo demand remained robust supported by the recovery in economic activities, and strengthening in manufacturing and goods trade. Air cargo demand improved in all regions, particularly in Africa and North America where traffic has expanded double-digitally. The Middle East also grew solidly, while Latin America/Caribbean posted the weakest performance and was the only region recording negative growth.
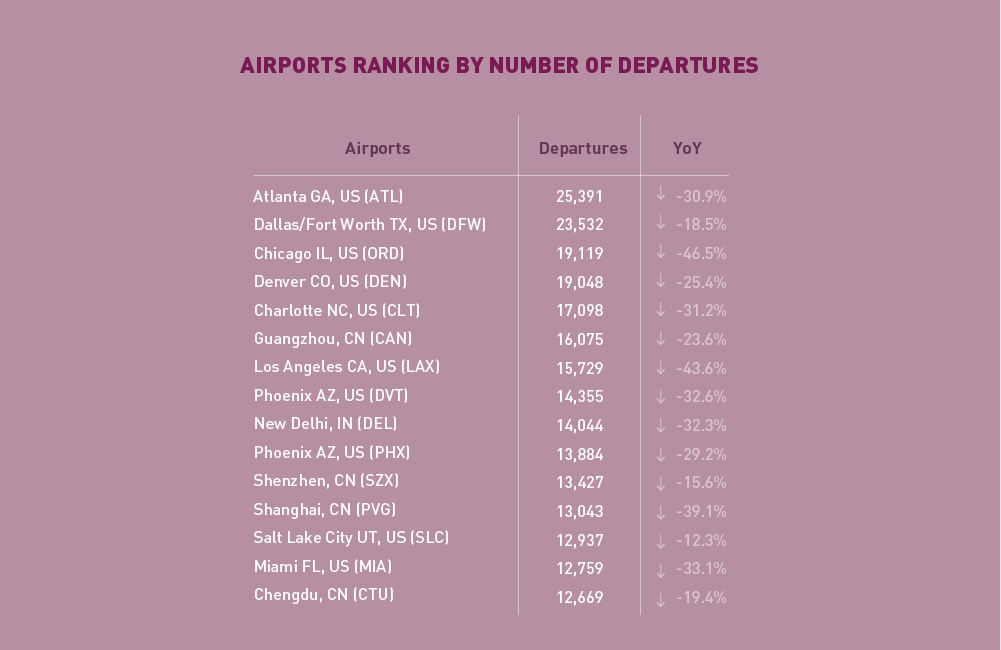
Top 15 Airports (Ranked by aircraft departures, passengers, and volume of freight)
Note: Figures include total scheduled and non-scheduled services
January 2021: 30.4%, -49.2%, and +21.0% YoY in terms of aircraft departures, passengers, and freight for the Top 15
In terms of aircraft departures, the Top 15 airports reported a combined fall of -30.4% YoY. US airports continued to be at top of the chart followed by Chinese airports. Atlanta retained the 1st position with -30.9% decline, followed by Dallas/Fort Worth (-18.5%). Salt Lake City reported the smallest fall at -12.3%, followed by Shenzhen (-15.6%).
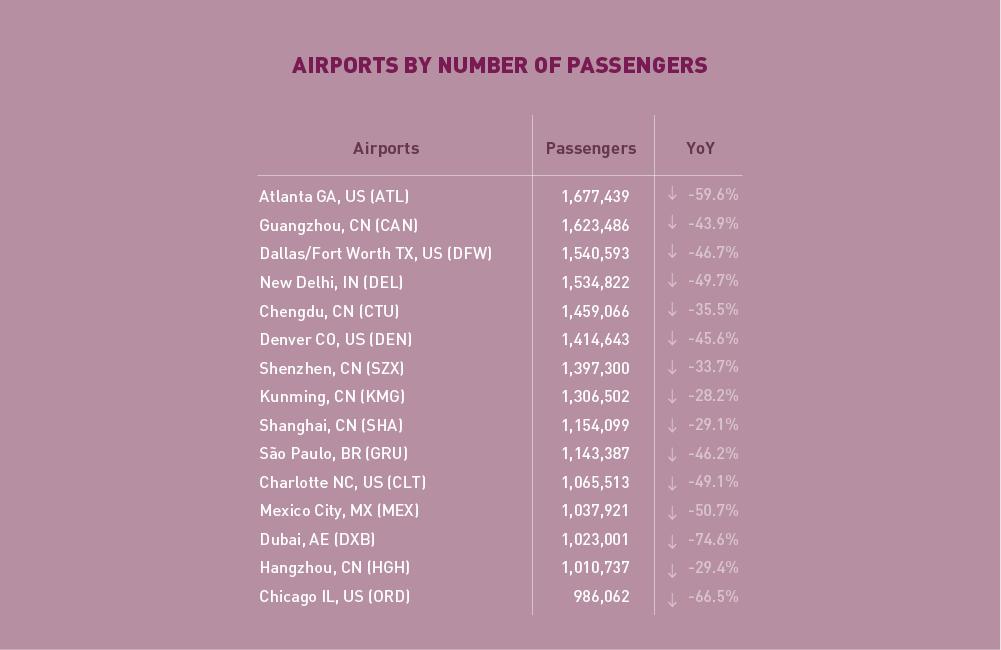
In terms of passengers, the Top 15 airports posted a total fall of -49.2% YoY. While Chinese and US airports continued to dominant Top15, few airports from Latin America/Caribbean and the Middle East also appeared in the list. Atlanta overtook Guangzhou became 1st, albeit with the third-largest YoY decline. The smallest contraction was posted by Kunming (-28.2%) and Shanghai (-29.1%).
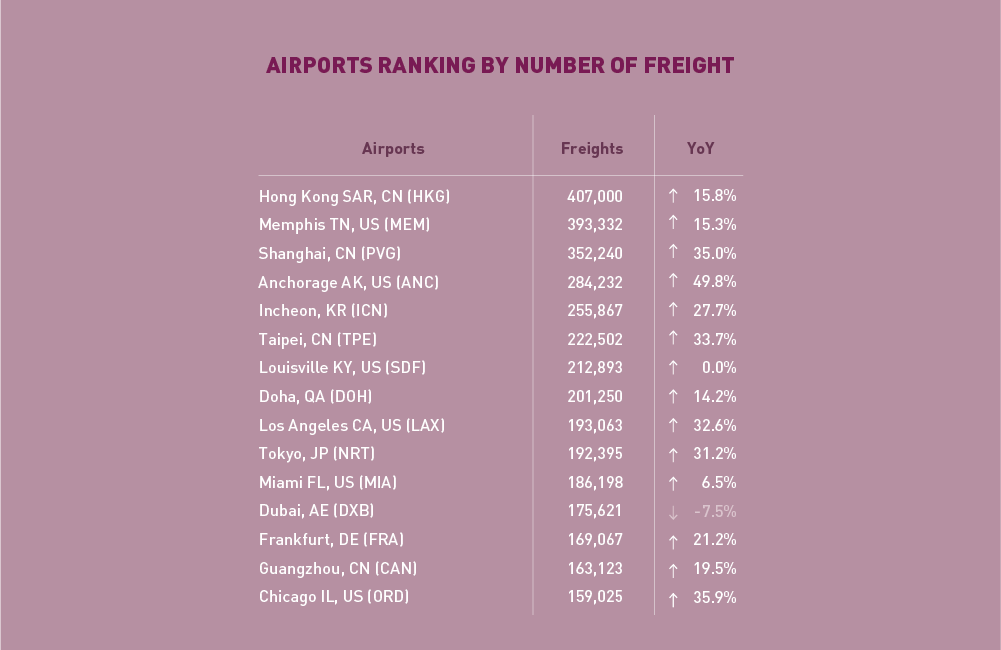
In terms of freight, the Top 15 airports reported a YoY increase of +21.0%. Unlike passenger traffic, air freight rose sharply with all Top 15 recording YoY growth, except for Dubai which posted a decline of -7.5%. Hong Kong retained the 1st position with a solid increase of +15.8%. The strongest growth was recorded by Anchorage at +49.8%.
Top 15 Airline Groups (Ranked by RPK)
January 2021: –67.7% YoY in terms of RPK for the Top 15
In terms of RPK, the Top 15 airline groups accounted for 52.3% of the world’s total RPK in January 2021 and declined by –67.7% YoY. This decline was 4.8 percentage points smaller than the fall in the world’s average RPK, with all airlines in the Top 15 posting contractions.
Airlines in the two largest domestic markets, US and China, continued to lead the recovery chart. However, their rankings changed significantly being hampered by virus resurgence at varying degrees.
For the first time since April 2020, the three major US airlines overtook Chinese airlines and became Top 3. This was mainly due to the sudden traffic fall in China. American ranked 1st with a similar decline as in December, followed by Delta and United. Southwest dropped one position to 8th.
All the three major Chinese airlines, China Southern, China Eastern, and Air China, posted noticeable deterioration in traffic as domestic travel was strictly controlled in response to the new outbreaks. Compared to December, the traffic of China Southern was down 40% from 15.6 billion to 9.3 billion RPKs, and the latter two showed approximately 30% less traffic.
Airlines in Europe maintained a similar decline as in the previous month. While AF-KLM climbed up one position to 7th, the recovery of Lufthansa and IAG slowed down and recorded the second and third largest YoY decline among the Top 15.
The traffic of both Emirates and LATAM trended sideways slightly, and ranked 11th and 14th, respectively.
Worldwide capacity contracted by -59.3% YoY in January 2021. All regions registered smaller capacity than in December, except for marginal increases in the Middle East and Latin America/Caribbean. The most noticeable decrease was seen in Asia/Pacific, affected by the new outbreaks.
Capacity in North America recovered the fastest, whereas Europe posted the largest capacity decline among all regions.
Click here to download the Monthly Monitor March PDF version.
For any queries for further information, please contact the ICAO Economic Development (ECD), Air Transport Bureau ecd@icao.int
Acronyms: ACI: Airports Council International; ASK: Available Seat-Kilometres; IATA: International Air Transport Association; FTK: Freight Tonne-Kilometres; LF: Passenger Load Factor; OAG: Official Airline Guide; RPK: Revenue Passenger-Kilometres; UNWTO: World Tourism Organization; YoY: Year-on-year; YTD: Year-to-date.